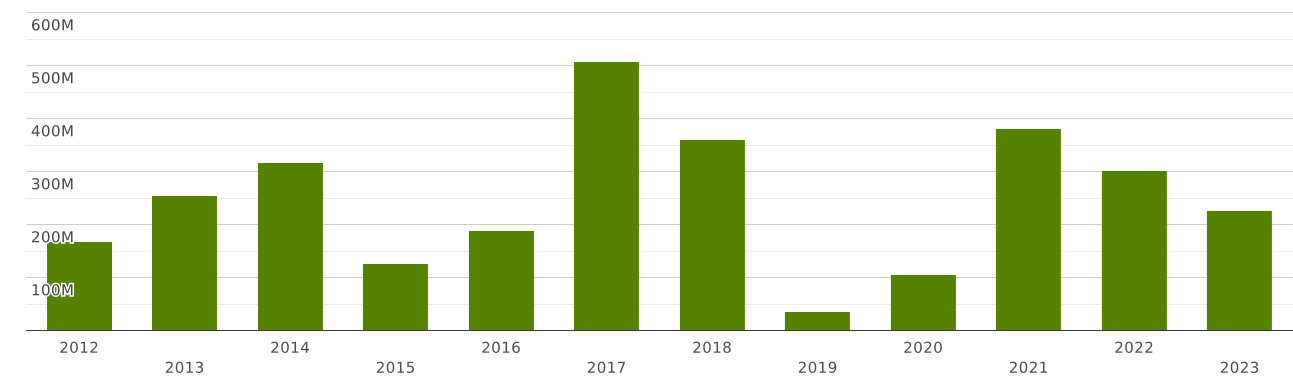
Singapore | Imports and Exports | World | Natural sands of all kinds, other than metalbearing sands of Chapter 26 | Value (US$) and Value Growth, YoY (%) | 2012 - 2023
The value of exports of commodity group 2505 "Natural sands of all kinds, whether or not coloured, other than metalbearing sands of Chapter 26." from Singapore totalled $ 537 thousand in 2023. Sales of commodity group 2505 from Singapore decreased by 13% in value terms compared to 2022. exports of commodity group 2505 "Natural sands of all kinds, whether or not coloured, other than metalbearing sands of Chapter 26." decreased by $ 80 thousand (cumulative exports of commodity group 2505 from Singapore amounted $617 thousand in 2022)
Exports of commodity group 2505 amounted to 1.05% of total sales of group "" from Singapore in 2023 (the value of exports of commodity group from Singapore amounted to $50 million in 2023). The share of exports of commodity group 2505 in sales of commodity group from Singapore increased by 0.271 p.p. compared to 2022 (it was 0.784% in 2022, and exports of commodity group from Singapore were $78 million).
Where does Singapore export Natural sands of all kinds, whether or not coloured, other than metalbearing sands of Chapter 26.?
Top export destinations of "Natural sands of all kinds, whether or not coloured, other than metalbearing sands of Chapter 26." from Singapore in 2023:
- British Indian Ocean Territories with a share of 19.8% (106 thousand US$)
- Malaysia with a share of 18.4% (99 thousand US$)
- Indonesia with a share of 14.3% (76 thousand US$)
- Thailand with a share of 6.56% (35 thousand US$)
- Bangladesh with a share of 6.01% (32 thousand US$)
- Philippines with a share of 5.19% (27 thousand US$)
- Other Asia, nes with a share of 5.16% (27 thousand US$)
- USA with a share of 4.21% (22 thousand US$)
- Spain with a share of 3.76% (20 thousand US$)
- Japan with a share of 3.53% (18.9 thousand US$)
Exports structure of 2505 - Natural sands of all kinds, whether or not coloured, other than metalbearing sands of Chapter 26. - from Singapore in 2023 represented by the following main commodity groups:
- 56% (301 thousand US$): 250510 - Silica sands & quartz sands, whether or not coloured
- 43% (235 thousand US$): 250590 - Natural sands other than silica & quartz, whether or not coloured, other than metalbearing sands of Ch.26
The value of imports of commodity group 2505 "Natural sands of all kinds, whether or not coloured, other than metalbearing sands of Chapter 26." to Singapore totalled $ 226 million in 2023. Sales of commodity group 2505 to Singapore decreased by 25% in value terms compared to 2022. imports of commodity group 2505 "Natural sands of all kinds, whether or not coloured, other than metalbearing sands of Chapter 26." decreased by $ 75 million (the value of imports of commodity group 2505 to Singapore was equal to $301 million in 2022)
Imports of commodity group 2505 "Natural sands of all kinds, whether or not coloured, other than metalbearing sands of Chapter 26." accounted for 0.053% of total import flow to Singapore (in 2023, total imports to Singapore amounted to $ 422 billion). The share of commodity group 2505 in total imports to Singapore decreased by 0.009 p.p. compared to 2022 (it was 0.063% in 2022 and cumulative imports to Singapore were equal to $ 475 billion).
Imports of commodity group 2505 reached 25% of total imports of group "" to Singapore in 2023 (imports of commodity group to Singapore totalled $870 million in 2023). The share of purchases of commodity group 2505 in imports of commodity group to Singapore went down by 5.07 p.p. compared to 2022 (it was 31% in 2022, and imports of commodity group to Singapore accounted for $971 million).
Where does Singapore import Natural sands of all kinds, whether or not coloured, other than metalbearing sands of Chapter 26. from?
Top trading partners (import of "Natural sands of all kinds, whether or not coloured, other than metalbearing sands of Chapter 26.") of Singapore in 2023:
- Malaysia with a share of 97% (219 million US$)
- Philippines with a share of 2.51% (5.68 million US$)
- USA - 460 thousand US$
- China - 210 thousand US$
- Australia - 145 thousand US$
- Belgium - 80 thousand US$
- France - 56 thousand US$
- Other Asia, nes - 55 thousand US$
- Turkey - 12.7 thousand US$
- Germany - 11.4 thousand US$
Imports structure of 2505 - Natural sands of all kinds, whether or not coloured, other than metalbearing sands of Chapter 26. - to Singapore in 2023 represented by the following main commodity groups:
- 81% (184 million US$): 250590 - Natural sands other than silica & quartz, whether or not coloured, other than metalbearing sands of Ch.26
- 18.5% (42 million US$): 250510 - Silica sands & quartz sands, whether or not coloured