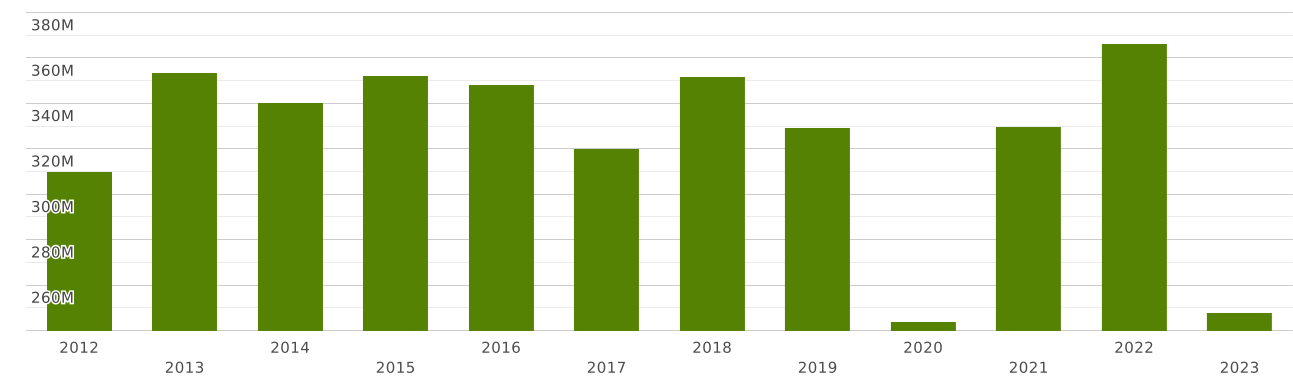
South Africa | Imports and Exports | World | Footwear with outer soles of rubber, plastics, leather or composition leather and uppers of textile materials | Value (US$) and Value Growth, YoY (%) | 2012 - 2023
| Commodity | Reporter | Partner | Trade flow | Indicator | 2012 | 2013 | 2014 | 2015 | 2016 | 2017 | 2018 | 2019 | 2020 | 2021 | 2022 | 2023 |
| 6404. Footwear with outer soles of rubber, plastics, leather or composition leather and uppers of textile materials | South Africa | World | Exports | Value (US$) | 37,762,986.00 | 43,893,269.57 | 44,975,228.75 | 41,452,952.02 | 38,146,607.98 | 42,289,322.21 | 44,060,039.12 | 41,769,534.97 | 28,572,718.95 | 39,494,889.78 | 44,477,091.34 | 31,802,082.09 |
| Value Growth, YoY (%) | 2.42 | 16.23 | 2.46 | -7.83 | -7.97 | 10.85 | 4.18 | -5.19 | -31.59 | 38.22 | 12.61 | -28.49 | ||||
| Imports | Value (US$) | 309,987,132.00 | 353,712,608.63 | 340,265,393.32 | 352,241,338.69 | 348,208,711.19 | 320,045,248.05 | 351,668,528.85 | 329,486,272.43 | 244,144,885.08 | 329,732,137.46 | 366,268,303.31 | 247,851,273.69 | |||
| Value Growth, YoY (%) | 19.54 | 14.10 | -3.80 | 3.51 | -1.14 | -8.08 | 9.88 | -6.30 | -25.90 | 35.05 | 11.08 | -32.33 |
The value of exports of commodity group 6404 "Footwear with outer soles of rubber, plastics, leather or composition leather and uppers of textile materials" from South Africa totalled $ 31 million in 2023. Sales of commodity group 6404 from South Africa decreased by 28% in value terms compared to 2022. exports of commodity group 6404 "Footwear with outer soles of rubber, plastics, leather or composition leather and uppers of textile materials" decreased by $ 12.6 million (cumulative exports of commodity group 6404 from South Africa amounted $44 million in 2022)
Exports of commodity group 6404 "Footwear with outer soles of rubber, plastics, leather or composition leather and uppers of textile materials" amounted to 0.028% of total exports from South Africa (cumulative merchandise exports from South Africa totalled $ 110 billion in 2023). The share of commodity group 6404 in total exports from South Africa decreased by 0.007 p.p. compared to 2022 (it was 0.036% in 2022 and cumulative exports from South Africa were equal to $ 121 billion).
Exports of commodity group 6404 amounted to 19.6% of total sales of group "" from South Africa in 2023 (the value of exports of commodity group from South Africa amounted to $161 million in 2023). The share of exports of commodity group 6404 in sales of commodity group from South Africa lowered by 6.06 p.p. compared to 2022 (it was 25% in 2022, and exports of commodity group from South Africa were $172 million).
Where does South Africa export Footwear with outer soles of rubber, plastics, leather or composition leather and uppers of textile materials?
Top export destinations of "Footwear with outer soles of rubber, plastics, leather or composition leather and uppers of textile materials" from South Africa in 2023:
- Namibia with a share of 31% (10.1 million US$)
- Botswana with a share of 24% (7.9 million US$)
- Swaziland with a share of 17% (5.43 million US$)
- Lesotho with a share of 11% (3.51 million US$)
- Zambia with a share of 3.07% (977 thousand US$)
- Mozambique with a share of 1.96% (624 thousand US$)
- Netherlands with a share of 1.34% (427 thousand US$)
- Mauritius with a share of 1.34% (426 thousand US$)
- Kenya with a share of 1.01% (322 thousand US$)
- Italy with a share of 1.01% (322 thousand US$)
Exports structure of 6404 - Footwear with outer soles of rubber, plastics, leather or composition leather and uppers of textile materials - from South Africa in 2023 represented by the following main commodity groups:
- 65% (20 million US$): 640419 - Footwear (excl. waterproof) with outer soles of rubber/plastics & uppers of textile mats. (excl. of 6404.11)
- 27% (8.81 million US$): 640411 - Sports footwear; tennis shoes, basketball shoes, gym shoes, training shoes and the like, with outer soles of rubber/plastics & uppers of textile mats.
- 7.04% (2.24 million US$): 640420 - Footwear with outer soles of leather/composition leather & uppers of textile mats.
The value of imports of commodity group 6404 "Footwear with outer soles of rubber, plastics, leather or composition leather and uppers of textile materials" to South Africa totalled $ 247 million in 2023. Sales of commodity group 6404 to South Africa decreased by 32% in value terms compared to 2022. imports of commodity group 6404 "Footwear with outer soles of rubber, plastics, leather or composition leather and uppers of textile materials" decreased by $ 118 million (the value of imports of commodity group 6404 to South Africa was equal to $366 million in 2022)
Imports of commodity group 6404 "Footwear with outer soles of rubber, plastics, leather or composition leather and uppers of textile materials" accounted for 0.231% of total import flow to South Africa (in 2023, total imports to South Africa amounted to $ 107 billion). The share of commodity group 6404 in total imports to South Africa decreased by 0.096 p.p. compared to 2022 (it was 0.327% in 2022 and cumulative imports to South Africa were equal to $ 111 billion).
Imports of commodity group 6404 reached 29% of total imports of group "" to South Africa in 2023 (imports of commodity group to South Africa totalled $837 million in 2023). The share of purchases of commodity group 6404 in imports of commodity group to South Africa went down by 6.41 p.p. compared to 2022 (it was 36% in 2022, and imports of commodity group to South Africa accounted for $1.01 billion).
Where does South Africa import Footwear with outer soles of rubber, plastics, leather or composition leather and uppers of textile materials from?
Top trading partners (import of "Footwear with outer soles of rubber, plastics, leather or composition leather and uppers of textile materials") of South Africa in 2023:
- China with a share of 49% (122 million US$)
- Vietnam with a share of 31% (78 million US$)
- Indonesia with a share of 9.03% (22 million US$)
- Italy with a share of 3.77% (9.35 million US$)
- Cambodia with a share of 2.16% (5.36 million US$)
- India - 2.28 million US$
- Philippines - 1.62 million US$
- Lesotho - 875 thousand US$
- Myanmar - 743 thousand US$
- Portugal - 641 thousand US$
Imports structure of 6404 - Footwear with outer soles of rubber, plastics, leather or composition leather and uppers of textile materials - to South Africa in 2023 represented by the following main commodity groups:
- 61% (153 million US$): 640419 - Footwear (excl. waterproof) with outer soles of rubber/plastics & uppers of textile mats. (excl. of 6404.11)
- 37% (92 million US$): 640411 - Sports footwear; tennis shoes, basketball shoes, gym shoes, training shoes and the like, with outer soles of rubber/plastics & uppers of textile mats.
- 0.962% (2.38 million US$): 640420 - Footwear with outer soles of leather/composition leather & uppers of textile mats.