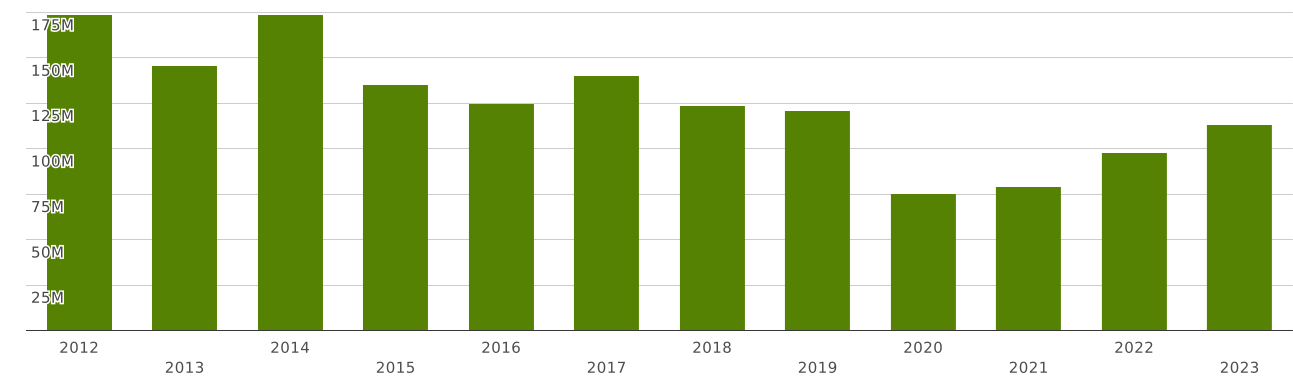
South Africa | Imports and Exports | World | Video game consoles and machines, articles for funfair, table or parlour games, including pintables, billiards, special tables for casino games and automatic bowling alley equipment | Value (US$) and Value Growth, YoY (%) | 2012 - 2023
The value of exports of commodity group 9504 "Articles for funfair, table or parlour games, including pintables, billiards, special tables for casino games and automatic bowling alley equipment" from South Africa totalled $ 10.1 million in 2023. Sales of commodity group 9504 from South Africa went up by 17.1% compared to 2022: exports of commodity group 9504 "Articles for funfair, table or parlour games, including pintables, billiards, special tables for casino games and automatic bowling alley equipment" went up by $ 1.47 million (cumulative exports of commodity group 9504 from South Africa amounted $8.64 million in 2022)
Exports of commodity group 9504 "Articles for funfair, table or parlour games, including pintables, billiards, special tables for casino games and automatic bowling alley equipment" amounted to 0.009% of total exports from South Africa (cumulative merchandise exports from South Africa totalled $ 110 billion in 2023). The share of commodity group 9504 in total exports from South Africa increased by 0.002 p.p. compared to 2022 (it was 0.007% in 2022 and cumulative exports from South Africa were equal to $ 121 billion).
Exports of commodity group 9504 amounted to 15.1% of total sales of group "" from South Africa in 2023 (the value of exports of commodity group from South Africa amounted to $66 million in 2023). The share of exports of commodity group 9504 in sales of commodity group from South Africa increased by 3.03 p.p. compared to 2022 (it was 12.1% in 2022, and exports of commodity group from South Africa were $71 million).
Where does South Africa export Articles for funfair, table or parlour games, including pintables, billiards, special tables for casino games and automatic bowling alley equipment?
Top export destinations of "Articles for funfair, table or parlour games, including pintables, billiards, special tables for casino games and automatic bowling alley equipment" from South Africa in 2023:
- Namibia with a share of 16.7% (1.69 million US$)
- Botswana with a share of 13.8% (1.39 million US$)
- Swaziland with a share of 9.46% (959 thousand US$)
- United Kingdom with a share of 7.08% (717 thousand US$)
- Seychelles with a share of 7.04% (713 thousand US$)
- Zambia with a share of 5.94% (602 thousand US$)
- Senegal with a share of 4.13% (419 thousand US$)
- Nigeria with a share of 3.35% (339 thousand US$)
- United Arab Emirates with a share of 3.28% (332 thousand US$)
- Mozambique with a share of 2.74% (278 thousand US$)
Exports structure of 9504 - Articles for funfair, table or parlour games, including pintables, billiards, special tables for casino games and automatic bowling alley equipment - from South Africa in 2023 represented by the following main commodity groups:
- 32% (3.32 million US$): 950490 - Games; articles for funfair, table or parlour games, including pintables, special tables for casino games, automatic bowling alley equipment, n.e.s. in heading 9504
- 24% (2.49 million US$): 950430 - Games other than video games/billiards, operated by coins/banknotes (paper currency)/discs/other sim. arts. (excl. bowling alley equip.)
- 13.4% (1.35 million US$): 950420 - Articles & accessories for billiards
- 1.46% (148 thousand US$): 950440 - Playing cards
The value of imports of commodity group 9504 "Articles for funfair, table or parlour games, including pintables, billiards, special tables for casino games and automatic bowling alley equipment" to South Africa totalled $ 113 million in 2023. Sales of commodity group 9504 to South Africa went up by 15.9% compared to 2022: imports of commodity group 9504 "Articles for funfair, table or parlour games, including pintables, billiards, special tables for casino games and automatic bowling alley equipment" went up by $ 15.5 million (the value of imports of commodity group 9504 to South Africa was equal to $97 million in 2022)
Imports of commodity group 9504 "Articles for funfair, table or parlour games, including pintables, billiards, special tables for casino games and automatic bowling alley equipment" accounted for 0.105% of total import flow to South Africa (in 2023, total imports to South Africa amounted to $ 107 billion). The share of commodity group 9504 in total imports to South Africa increased by 0.018 p.p. compared to 2022 (it was 0.087% in 2022 and cumulative imports to South Africa were equal to $ 111 billion).
Imports of commodity group 9504 reached 29% of total imports of group "" to South Africa in 2023 (imports of commodity group to South Africa totalled $388 million in 2023). The share of purchases of commodity group 9504 in total imports of commodity group to South Africa increased by 6.78 p.p. compared to 2022 (it was 22% in 2022, and imports of commodity group to South Africa accounted for $437 million).
Where does South Africa import Articles for funfair, table or parlour games, including pintables, billiards, special tables for casino games and automatic bowling alley equipment from?
Top trading partners (import of "Articles for funfair, table or parlour games, including pintables, billiards, special tables for casino games and automatic bowling alley equipment") of South Africa in 2023:
- China with a share of 60% (68 million US$)
- USA with a share of 14.4% (16.3 million US$)
- Austria with a share of 7.54% (8.55 million US$)
- Czech Republic with a share of 2.66% (3.02 million US$)
- Mexico with a share of 2.46% (2.79 million US$)
- United Kingdom with a share of 1.25% (1.41 million US$)
- Australia with a share of 1.19% (1.35 million US$)
- Spain with a share of 1% (1.14 million US$)
- Philippines - 1.1 million US$
- Slovenia - 1.06 million US$
Imports structure of 9504 - Articles for funfair, table or parlour games, including pintables, billiards, special tables for casino games and automatic bowling alley equipment - to South Africa in 2023 represented by the following main commodity groups:
- 27% (31 million US$): 950430 - Games other than video games/billiards, operated by coins/banknotes (paper currency)/discs/other sim. arts. (excl. bowling alley equip.)
- 11.2% (12.7 million US$): 950490 - Games; articles for funfair, table or parlour games, including pintables, special tables for casino games, automatic bowling alley equipment, n.e.s. in heading 9504
- 4.78% (5.42 million US$): 950440 - Playing cards
- 1.74% (1.97 million US$): 950420 - Articles & accessories for billiards