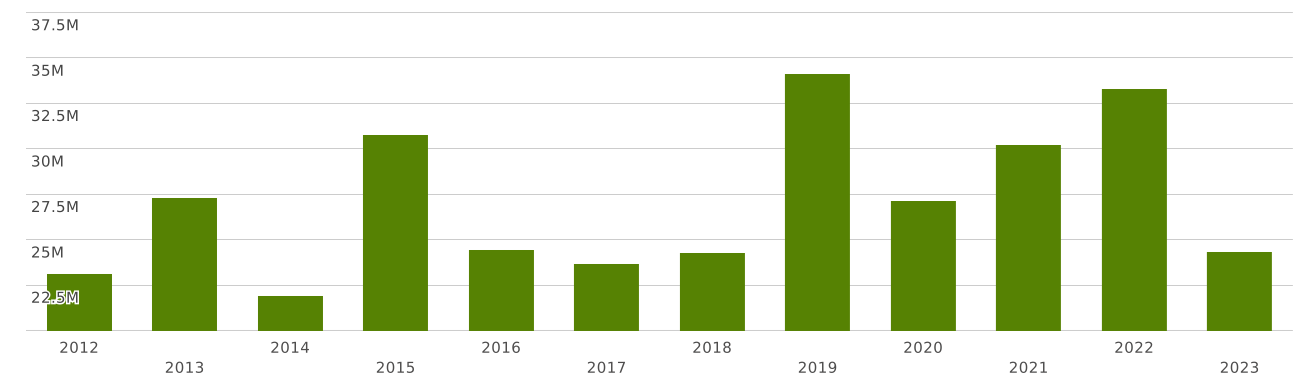
Sweden | Imports and Exports | World | Live animals | Value (US$) and Value Growth, YoY (%) | 2012 - 2023
The value of exports of commodity group 01 "Live animals" from Sweden totalled $ 32 million in 2023. Sales of commodity group 01 from Sweden went up by 9.95% compared to 2022: exports of commodity group 01 "Live animals" went up by $ 2.91 million (cumulative exports of commodity group 01 from Sweden amounted $29 million in 2022)
Exports of commodity group 01 "Live animals" amounted to 0.016% of total exports from Sweden (cumulative merchandise exports from Sweden totalled $ 197 billion in 2023). The share of commodity group 01 in total exports from Sweden increased by 0.001 p.p. compared to 2022 (it was 0.014% in 2022 and cumulative exports from Sweden were equal to $ 197 billion).
Where does Sweden export Live animals?
Top export destinations of "Live animals" from Sweden in 2023:
- Denmark with a share of 25% (8.05 million US$)
- USA with a share of 21% (6.78 million US$)
- Norway with a share of 10.4% (3.36 million US$)
- Finland with a share of 9.91% (3.19 million US$)
- Hungary with a share of 9.31% (2.99 million US$)
- Germany with a share of 7.18% (2.31 million US$)
- Belgium with a share of 4.79% (1.54 million US$)
- Netherlands with a share of 4.59% (1.47 million US$)
- Switzerland with a share of 3.4% (1.09 million US$)
- Poland with a share of 1.54% (498 thousand US$)
Exports structure of 01 - Live animals - from Sweden in 2023 represented by the following main commodity groups:
- 50% (16.1 million US$): 0105 - Live poultry, that is to say, fowls of the species Gallus domesticus, ducks, geese, turkeys and guinea fowls
- 46% (15.1 million US$): 0101 - Live horses, asses, mules and hinnies
- 2.84% (915 thousand US$): 0106 - Other live animals
- 0.163% (52 thousand US$): 0103 - Live swine
- 0% (188 US$): 0104 - Live sheep and goats
The value of imports of commodity group 01 "Live animals" to Sweden totalled $ 24 million in 2023. Sales of commodity group 01 to Sweden decreased by 26% in value terms compared to 2022. imports of commodity group 01 "Live animals" decreased by $ 8.99 million (the value of imports of commodity group 01 to Sweden was equal to $33 million in 2022)
Imports of commodity group 01 "Live animals" accounted for 0.012% of total import flow to Sweden (in 2023, total imports to Sweden amounted to $ 193 billion). The share of commodity group 01 in total imports to Sweden decreased by 0.003 p.p. compared to 2022 (it was 0.016% in 2022 and cumulative imports to Sweden were equal to $ 202 billion).
Imports of commodity group 01 reached 99% of total imports of group 01 "Live animals" to Sweden in 2023 (imports of commodity group 01 to Sweden totalled $24 million in 2023). The share of purchases of commodity group 01 in imports of commodity group 01 to Sweden went down by 0 p.p. compared to 2022 (it was 100% in 2022, and imports of commodity group 01 to Sweden accounted for $33 million).
Where does Sweden import Live animals from?
Top trading partners (import of "Live animals") of Sweden in 2023:
- Netherlands with a share of 25% (6.3 million US$)
- USA with a share of 18.7% (4.56 million US$)
- Denmark with a share of 14.9% (3.62 million US$)
- Belgium with a share of 13.6% (3.31 million US$)
- Norway with a share of 7.82% (1.9 million US$)
- France with a share of 7.5% (1.82 million US$)
- United Kingdom with a share of 3.29% (801 thousand US$)
- Germany with a share of 2.33% (568 thousand US$)
- Finland with a share of 1.65% (403 thousand US$)
- Iceland with a share of 1.45% (353 thousand US$)
Imports structure of 01 - Live animals - to Sweden in 2023 represented by the following main commodity groups:
- 47% (11.5 million US$): 0101 - Live horses, asses, mules and hinnies
- 26% (6.5 million US$): 0105 - Live poultry, that is to say, fowls of the species Gallus domesticus, ducks, geese, turkeys and guinea fowls
- 25% (6.1 million US$): 0106 - Other live animals
- 0.706% (171 thousand US$): 0103 - Live swine
- 0.03% (7.44 thousand US$): 0102 - Live bovine animals
- 0.017% (4.14 thousand US$): 0104 - Live sheep and goats