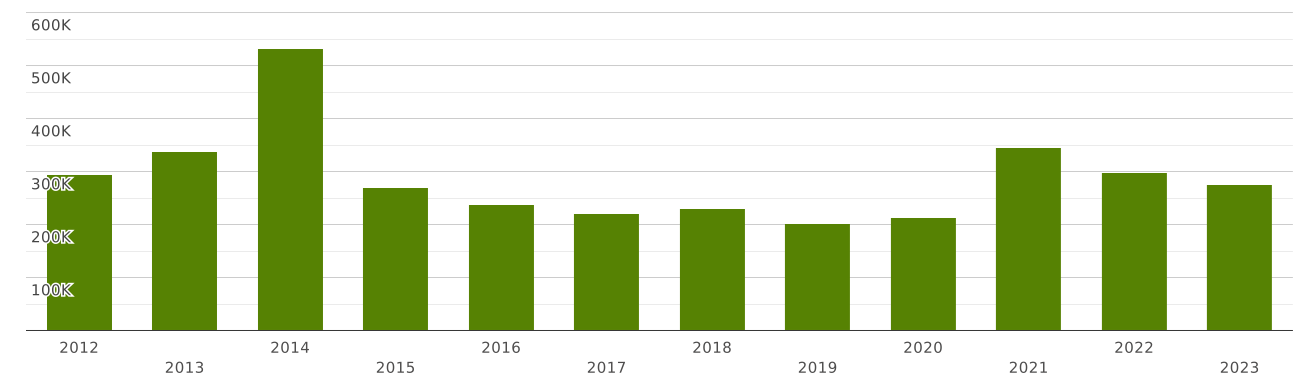
Tanzania | Imports and Exports | World | Olive Oil | Value (US$) and Value Growth, YoY (%) | 2012 - 2023
The value of exports of commodity group 1509 "Olive oil and its fractions, whether or not refined, but not chemically modified" from Tanzania totalled $ 90 thousand in 2023. Sales of commodity group 1509 from Tanzania went up by 10.8% compared to 2022: exports of commodity group 1509 "Olive oil and its fractions, whether or not refined, but not chemically modified" went up by $ 8.85 thousand (cumulative exports of commodity group 1509 from Tanzania amounted $81 thousand in 2022)
Exports of commodity group 1509 "Olive oil and its fractions, whether or not refined, but not chemically modified" amounted to 0.001% of total exports from Tanzania (cumulative merchandise exports from Tanzania totalled $ 7.27 billion in 2023). The share of commodity group 1509 in total exports from Tanzania decreased by 0 p.p. compared to 2022 (it was 0.001% in 2022 and cumulative exports from Tanzania were equal to $ 6.82 billion).
Exports of commodity group 1509 amounted to 0.461% of total sales of group "" from Tanzania in 2023 (the value of exports of commodity group from Tanzania amounted to $19.6 million in 2023). The share of exports of commodity group 1509 in sales of commodity group from Tanzania increased by 0.026 p.p. compared to 2022 (it was 0.435% in 2022, and exports of commodity group from Tanzania were $18.7 million).
Where does Tanzania export Olive oil and its fractions, whether or not refined, but not chemically modified?
Top export destinations of "Olive oil and its fractions, whether or not refined, but not chemically modified" from Tanzania in 2023:
- Spain with a share of 99% (90 thousand US$)
- Burundi - 96 US$
Exports structure of 1509 - Olive oil and its fractions, whether or not refined, but not chemically modified - from Tanzania in 2023 represented by the following main commodity groups:
- 100% (90 thousand US$): 150990 - Olive oil (excl. crude & virgin) & fractions thereof , whether or not ref. but not chemically modified
The value of imports of commodity group 1509 "Olive oil and its fractions, whether or not refined, but not chemically modified" to Tanzania totalled $ 275 thousand in 2023. Sales of commodity group 1509 to Tanzania decreased by 7.45% in value terms compared to 2022. imports of commodity group 1509 "Olive oil and its fractions, whether or not refined, but not chemically modified" decreased by $ 22 thousand (the value of imports of commodity group 1509 to Tanzania was equal to $297 thousand in 2022)
Imports of commodity group 1509 "Olive oil and its fractions, whether or not refined, but not chemically modified" accounted for 0.001% of total import flow to Tanzania (in 2023, total imports to Tanzania amounted to $ 15.1 billion). The share of commodity group 1509 in total imports to Tanzania decreased by 0 p.p. compared to 2022 (it was 0.001% in 2022 and cumulative imports to Tanzania were equal to $ 15.6 billion).
Imports of commodity group 1509 reached 0.124% of total imports of group "" to Tanzania in 2023 (imports of commodity group to Tanzania totalled $220 million in 2023). The share of purchases of commodity group 1509 in imports of commodity group to Tanzania went down by 0.047 p.p. compared to 2022 (it was 0.172% in 2022, and imports of commodity group to Tanzania accounted for $172 million).
Where does Tanzania import Olive oil and its fractions, whether or not refined, but not chemically modified from?
Top trading partners (import of "Olive oil and its fractions, whether or not refined, but not chemically modified") of Tanzania in 2023:
- Italy with a share of 59% (164 thousand US$)
- Tunisia with a share of 20% (56 thousand US$)
- Spain with a share of 7.03% (19.3 thousand US$)
- United Arab Emirates with a share of 6.52% (17.9 thousand US$)
- United Kingdom with a share of 4.12% (11.3 thousand US$)
- Algeria - 1.58 thousand US$
- China - 1.54 thousand US$
- South Africa - 1.2 thousand US$
- Turkey - 813 US$
- India - 294 US$
Imports structure of 1509 - Olive oil and its fractions, whether or not refined, but not chemically modified - to Tanzania in 2023 represented by the following main commodity groups:
- 11.3% (31 thousand US$): 150990 - Olive oil (excl. crude & virgin) & fractions thereof , whether or not ref. but not chemically modified