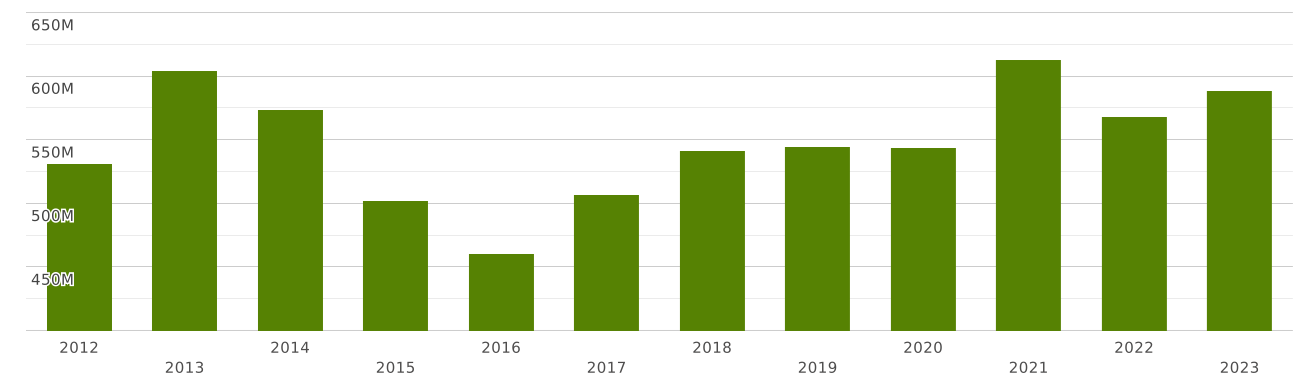
Tunisia | Imports and Exports | World | Pharmaceutical products | Value (US$) and Value Growth, YoY (%) | 2012 - 2023
The value of exports of commodity group 30 "Pharmaceutical products" from Tunisia totalled $ 113 million in 2023. Sales of commodity group 30 from Tunisia went up by 6.22% compared to 2022: exports of commodity group 30 "Pharmaceutical products" went up by $ 6.68 million (cumulative exports of commodity group 30 from Tunisia amounted $107 million in 2022)
Exports of commodity group 30 "Pharmaceutical products" amounted to 0.568% of total exports from Tunisia (cumulative merchandise exports from Tunisia totalled $ 20 billion in 2023). The share of commodity group 30 in total exports from Tunisia decreased by 0.009 p.p. compared to 2022 (it was 0.578% in 2022 and cumulative exports from Tunisia were equal to $ 18.5 billion).
Where does Tunisia export Pharmaceutical products?
Top export destinations of "Pharmaceutical products" from Tunisia in 2023:
- France with a share of 36% (41 million US$)
- Libya with a share of 21% (24 million US$)
- Saudi Arabia with a share of 7.81% (8.9 million US$)
- Ireland with a share of 7.71% (8.78 million US$)
- Lebanon with a share of 5.84% (6.65 million US$)
- Iraq with a share of 3.18% (3.63 million US$)
- Algeria with a share of 2.33% (2.66 million US$)
- Germany with a share of 2.22% (2.53 million US$)
- Jordan with a share of 1.96% (2.23 million US$)
- Mauritania with a share of 1.9% (2.17 million US$)
Exports structure of 30 - Pharmaceutical products - from Tunisia in 2023 represented by the following main commodity groups:
- 83% (95 million US$): 3004 - Medicaments (excluding goods of heading 30.02, 30.05 or 30.06) consisting of mixed or unmixed products for therapeutic or prophylactic uses, put up in measured doses (including those in the form of transdermal administration systems) or in forms or packings for retail sale
- 12.4% (14.1 million US$): 3006 - Pharmaceutical goods specified in Note 4 to this Chapter.
- 1.91% (2.18 million US$): 3005 - Wadding, gauze, bandages and similar articles (for example, dressings, adhesive plasters, poultices), impregnated or coated with pharmaceutical substances or put up in forms or packings for retail sale for medical, surgical, dental or veterinary purposes.
- 1.32% (1.5 million US$): 3002 - Human blood; animal blood for therapeutic, prophylactic or diagnostic uses; antisera, other blood fractions, immunological products, modified or obtained by biotechnological processes; vaccines, toxins, cultures of micro-organisms (excluding yeasts) etc
- 0.646% (736 thousand US$): 3003 - Medicaments (excluding goods of heading 30.02, 30.05 or 30.06) consisting of two or more constituents which have been mixed together for therapeutic or prophylactic uses, not put up in measured doses or in forms or packings for retail sale
The value of imports of commodity group 30 "Pharmaceutical products" to Tunisia totalled $ 588 million in 2023. Sales of commodity group 30 to Tunisia went up by 3.55% compared to 2022: imports of commodity group 30 "Pharmaceutical products" went up by $ 20 million (the value of imports of commodity group 30 to Tunisia was equal to $568 million in 2022)
Imports of commodity group 30 "Pharmaceutical products" accounted for 2.26% of total import flow to Tunisia (in 2023, total imports to Tunisia amounted to $ 25 billion). The share of commodity group 30 in total imports to Tunisia increased by 0.138 p.p. compared to 2022 (it was 2.13% in 2022 and cumulative imports to Tunisia were equal to $ 26 billion).
Where does Tunisia import Pharmaceutical products from?
Top trading partners (import of "Pharmaceutical products") of Tunisia in 2023:
- France with a share of 20% (121 million US$)
- Germany with a share of 17.8% (104 million US$)
- Italy with a share of 9.44% (55 million US$)
- United Kingdom with a share of 5.19% (30 million US$)
- Denmark with a share of 4.98% (29 million US$)
- Ireland with a share of 4.91% (28 million US$)
- Switzerland with a share of 4.84% (28 million US$)
- India with a share of 3.33% (19.6 million US$)
- China with a share of 3.18% (18.7 million US$)
- Spain with a share of 2.78% (16.3 million US$)
Imports structure of 30 - Pharmaceutical products - to Tunisia in 2023 represented by the following main commodity groups:
- 44% (264 million US$): 3004 - Medicaments (excluding goods of heading 30.02, 30.05 or 30.06) consisting of mixed or unmixed products for therapeutic or prophylactic uses, put up in measured doses (including those in the form of transdermal administration systems) or in forms or packings for retail sale
- 36% (216 million US$): 3003 - Medicaments (excluding goods of heading 30.02, 30.05 or 30.06) consisting of two or more constituents which have been mixed together for therapeutic or prophylactic uses, not put up in measured doses or in forms or packings for retail sale
- 11.4% (67 million US$): 3002 - Human blood; animal blood for therapeutic, prophylactic or diagnostic uses; antisera, other blood fractions, immunological products, modified or obtained by biotechnological processes; vaccines, toxins, cultures of micro-organisms (excluding yeasts) etc
- 4.46% (26 million US$): 3006 - Pharmaceutical goods specified in Note 4 to this Chapter.
- 1.7% (10 million US$): 3001 - Glands, organs (extracts, secretions thereof) for organo-therapeutic uses, dried, powdered or not; heparin and its salts; other human or animal substances for therapeutic or prophylactic uses n.e.s.
- 0.826% (4.86 million US$): 3005 - Wadding, gauze, bandages and similar articles (for example, dressings, adhesive plasters, poultices), impregnated or coated with pharmaceutical substances or put up in forms or packings for retail sale for medical, surgical, dental or veterinary purposes.