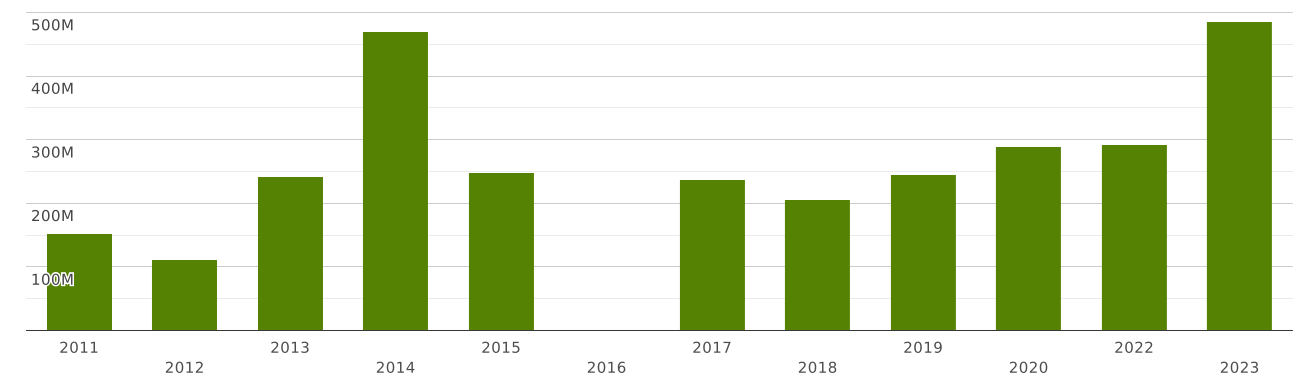
Turkey | Imports and Exports | World | Rice | Value (US$) and Value Growth, YoY (%) | 2011 - 2023
The value of exports of commodity group 1006 "Rice" from Turkey totalled $ 178 million in 2023. Sales of commodity group 1006 from Turkey went up by 15.8% compared to 2022: exports of commodity group 1006 "Rice" went up by $ 24 million (cumulative exports of commodity group 1006 from Turkey amounted $154 million in 2022)
Exports of commodity group 1006 "Rice" amounted to 0.069% of total exports from Turkey (cumulative merchandise exports from Turkey totalled $ 255 billion in 2023). The share of commodity group 1006 in total exports from Turkey increased by 0.009 p.p. compared to 2022 (it was 0.06% in 2022 and cumulative exports from Turkey were equal to $ 254 billion).
Exports of commodity group 1006 amounted to 10.2% of total sales of group "" from Turkey in 2023 (the value of exports of commodity group from Turkey amounted to $1.73 billion in 2023). The share of exports of commodity group 1006 in sales of commodity group from Turkey lowered by 12 p.p. compared to 2022 (it was 22% in 2022, and exports of commodity group from Turkey were $688 million).
Where does Turkey export Rice?
Top export destinations of "Rice" from Turkey in 2023:
- Syrian Arab Republic with a share of 25% (45 million US$)
- Ukraine with a share of 9.26% (16.5 million US$)
- Algeria with a share of 6.72% (11.9 million US$)
- Iraq with a share of 6.09% (10.8 million US$)
- Israel with a share of 5.57% (9.93 million US$)
- Saudi Arabia with a share of 5.15% (9.2 million US$)
- Lebanon with a share of 4.95% (8.83 million US$)
- Spain with a share of 3.73% (6.65 million US$)
- Belgium with a share of 2.97% (5.3 million US$)
- Albania with a share of 2.6% (4.64 million US$)
Exports structure of 1006 - Rice - from Turkey in 2023 represented by the following main commodity groups:
- 95% (170 million US$): 100630 - Semi-milled/wholly milled rice, whether or not polished/glazed
- 4.42% (7.89 million US$): 100640 - Broken rice
- 0.165% (295 thousand US$): 100610 - Rice in the husk (paddy/rough)
- 0.07% (126 thousand US$): 100620 - Husked (brown) rice
The value of imports of commodity group 1006 "Rice" to Turkey totalled $ 485 million in 2023. Sales of commodity group 1006 to Turkey went up by 65% compared to 2022: imports of commodity group 1006 "Rice" went up by $ 191 million (the value of imports of commodity group 1006 to Turkey was equal to $293 million in 2022)
Imports of commodity group 1006 "Rice" accounted for 0.134% of total import flow to Turkey (in 2023, total imports to Turkey amounted to $ 361 billion). The share of commodity group 1006 in total imports to Turkey increased by 0.053 p.p. compared to 2022 (it was 0.08% in 2022 and cumulative imports to Turkey were equal to $ 363 billion).
Imports of commodity group 1006 reached 9.55% of total imports of group "" to Turkey in 2023 (imports of commodity group to Turkey totalled $5.07 billion in 2023). The share of purchases of commodity group 1006 in total imports of commodity group to Turkey increased by 4.09 p.p. compared to 2022 (it was 5.46% in 2022, and imports of commodity group to Turkey accounted for $5.36 billion).
Where does Turkey import Rice from?
Top trading partners (import of "Rice") of Turkey in 2023:
- China with a share of 27% (131 million US$)
- Thailand with a share of 14.4% (70 million US$)
- India with a share of 13.5% (65 million US$)
- Vietnam with a share of 10.8% (52 million US$)
- Argentina with a share of 6.9% (33 million US$)
- Bulgaria with a share of 6.72% (32 million US$)
- Myanmar with a share of 5.81% (28 million US$)
- Greece with a share of 5.72% (27 million US$)
- Uruguay with a share of 3.15% (15.2 million US$)
- Italy with a share of 2.7% (13.1 million US$)
Imports structure of 1006 - Rice - to Turkey in 2023 represented by the following main commodity groups:
- 92% (448 million US$): 100630 - Semi-milled/wholly milled rice, whether or not polished/glazed
- 6.68% (32 million US$): 100610 - Rice in the husk (paddy/rough)
- 0.899% (4.36 million US$): 100620 - Husked (brown) rice
- 0.032% (155 thousand US$): 100640 - Broken rice