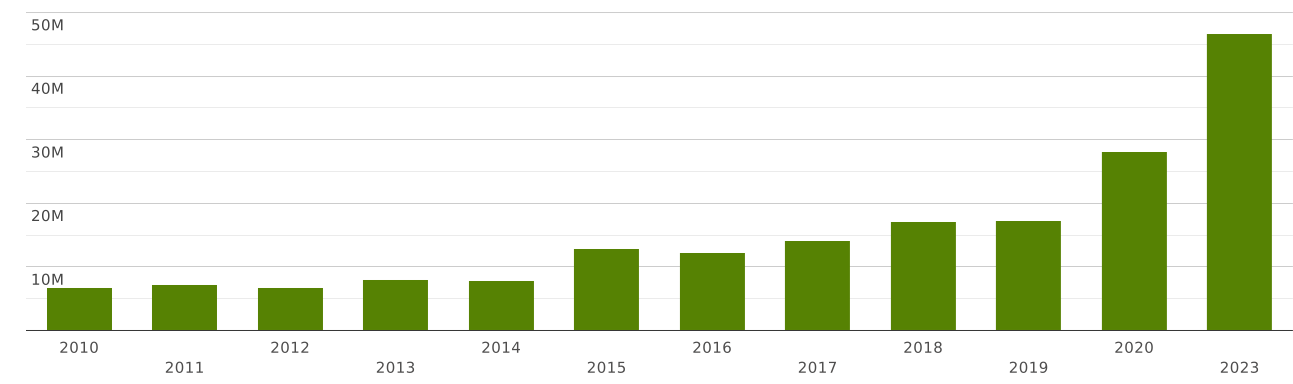
Uganda | Imports and Exports | World | Oil seeds and oleaginous fruits; miscellaneous grains,seeds and fruit; industrial or medicinal plants; straw and fodder | Value (US$) and Value Growth, YoY (%) | 2010 - 2023
The value of exports of commodity group 12 "Oil seeds and oleaginous fruits; miscellaneous grains, seeds and fruits; industrial or medicinal plants; straw and fodder" from Uganda totalled $ 63 million in 2023. (cumulative exports of commodity group 12 from Uganda amounted $ in 2022)
Exports of commodity group 12 "Oil seeds and oleaginous fruits; miscellaneous grains, seeds and fruits; industrial or medicinal plants; straw and fodder" amounted to 1% of total exports from Uganda (cumulative merchandise exports from Uganda totalled $ 6.3 billion in 2023).
Where does Uganda export Oil seeds and oleaginous fruits; miscellaneous grains, seeds and fruits; industrial or medicinal plants; straw and fodder?
Top export destinations of "Oil seeds and oleaginous fruits; miscellaneous grains, seeds and fruits; industrial or medicinal plants; straw and fodder" from Uganda in 2023:
- Kenya with a share of 20% (12.7 million US$)
- Germany with a share of 16.4% (10.4 million US$)
- China with a share of 10.6% (6.74 million US$)
- Netherlands with a share of 10% (6.36 million US$)
- Rwanda with a share of 8.88% (5.64 million US$)
- Turkey with a share of 5.81% (3.69 million US$)
- France with a share of 5% (3.17 million US$)
- Israel with a share of 3.47% (2.2 million US$)
- Canada with a share of 3.16% (2.01 million US$)
- Austria with a share of 3.1% (1.97 million US$)
Exports structure of 12 - Oil seeds and oleaginous fruits; miscellaneous grains, seeds and fruits; industrial or medicinal plants; straw and fodder - from Uganda in 2023 represented by the following main commodity groups:
- 61% (39 million US$): 1207 - Other oil seeds and oleaginous fruits, whether or not broken, n.e.s. in chapter 12
- 25% (15.9 million US$): 1201 - Soya beans, whether or not broken
- 7.48% (4.75 million US$): 1202 - Ground-nuts, not roasted or otherwise cooked, whether or not shelled or broken.
- 2.57% (1.63 million US$): 1209 - Seeds, fruit and spores, of a kind used for sowing
- 1.77% (1.12 million US$): 1206 - Sunflower seeds, whether or not broken
- 0.445% (283 thousand US$): 1212 - Locust beans, seaweeds and other algae, sugar beet, sugar cane, fresh, chilled, frozen or dried, whether or not ground; fruit stones, kernels and other vegetable products (including unroasted chicory roots) used primarily for human consumption, n.e.s.
- 0.38% (241 thousand US$): 1208 - Flours and meals of oil seeds or oleaginous fruits, other than those of mustard
- 0.232% (147 thousand US$): 1203 - Copra
- 0.121% (77 thousand US$): 1211 - Plants and parts of plants (including seeds and fruits), of a kind used primarily in perfumery, in pharmacy or for insecticidal, fungicidal or similar purposes, fresh or dried, whether or not cut, crushed or powdered
- 0.085% (54 thousand US$): 1213 - Cereal straw and husks, unprepared, whether or not chopped, ground, pressed or in the form of pellets
The value of imports of commodity group 12 "Oil seeds and oleaginous fruits; miscellaneous grains, seeds and fruits; industrial or medicinal plants; straw and fodder" to Uganda totalled $ 46 million in 2023. (the value of imports of commodity group 12 to Uganda was equal to $ in 2022)
Imports of commodity group 12 "Oil seeds and oleaginous fruits; miscellaneous grains, seeds and fruits; industrial or medicinal plants; straw and fodder" accounted for 0.395% of total import flow to Uganda (in 2023, total imports to Uganda amounted to $ 11.7 billion).
Where does Uganda import Oil seeds and oleaginous fruits; miscellaneous grains, seeds and fruits; industrial or medicinal plants; straw and fodder from?
Top trading partners (import of "Oil seeds and oleaginous fruits; miscellaneous grains, seeds and fruits; industrial or medicinal plants; straw and fodder") of Uganda in 2023:
- Tanzania with a share of 58% (27 million US$)
- India with a share of 9.15% (4.27 million US$)
- Zambia with a share of 6.68% (3.11 million US$)
- USA with a share of 3.46% (1.61 million US$)
- South Africa with a share of 3.43% (1.6 million US$)
- Kenya with a share of 2.52% (1.17 million US$)
- Cameroon with a share of 2.14% (999 thousand US$)
- Germany with a share of 1.92% (899 thousand US$)
- Chile with a share of 1.79% (834 thousand US$)
- Netherlands with a share of 1.35% (632 thousand US$)
Imports structure of 12 - Oil seeds and oleaginous fruits; miscellaneous grains, seeds and fruits; industrial or medicinal plants; straw and fodder - to Uganda in 2023 represented by the following main commodity groups:
- 54% (25 million US$): 1202 - Ground-nuts, not roasted or otherwise cooked, whether or not shelled or broken.
- 36% (17.1 million US$): 1209 - Seeds, fruit and spores, of a kind used for sowing
- 2.74% (1.27 million US$): 1207 - Other oil seeds and oleaginous fruits, whether or not broken, n.e.s. in chapter 12
- 2.18% (1.01 million US$): 1206 - Sunflower seeds, whether or not broken
- 2.14% (998 thousand US$): 1210 - Hop cones, fresh or dried, whether or not ground, powdered or in the form of pellets; lupulin
- 0.631% (294 thousand US$): 1201 - Soya beans, whether or not broken
- 0.423% (197 thousand US$): 1212 - Locust beans, seaweeds and other algae, sugar beet, sugar cane, fresh, chilled, frozen or dried, whether or not ground; fruit stones, kernels and other vegetable products (including unroasted chicory roots) used primarily for human consumption, n.e.s.
- 0.109% (51 thousand US$): 1211 - Plants and parts of plants (including seeds and fruits), of a kind used primarily in perfumery, in pharmacy or for insecticidal, fungicidal or similar purposes, fresh or dried, whether or not cut, crushed or powdered
- 0.017% (8.03 thousand US$): 1208 - Flours and meals of oil seeds or oleaginous fruits, other than those of mustard
- 0.003% (1.78 thousand US$): 1204 - Linseed, whether or not broken