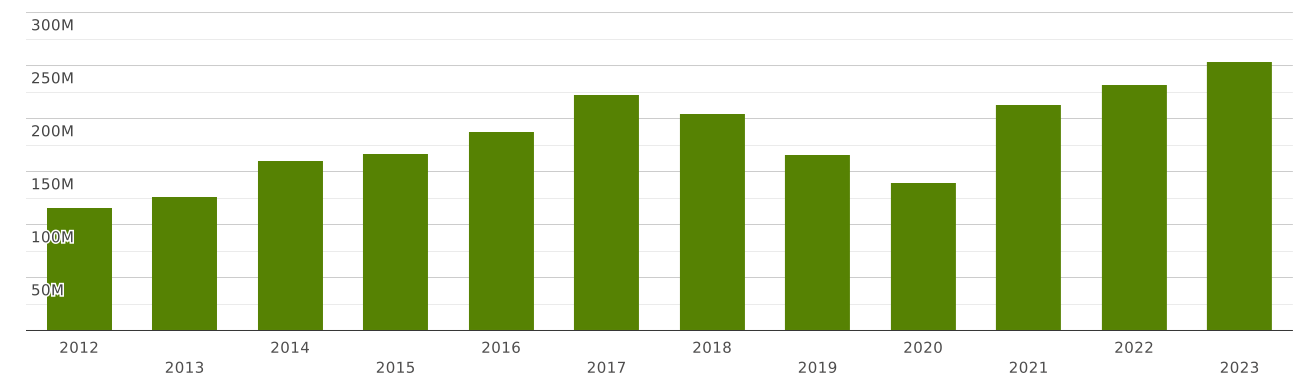
United Arab Emirates | Imports and Exports | World | Coconuts, Brazil nuts, cashew nuts | Value (US$) and Value Growth, YoY (%) | 2012 - 2023
The value of exports of commodity group 0801 "Coconuts, Brazil nuts and cashew nuts, fresh or dried, whether or not shelled or peeled" from United Arab Emirates totalled $ 186 million in 2023. Sales of commodity group 0801 from United Arab Emirates went up by 4.98% compared to 2022: exports of commodity group 0801 "Coconuts, Brazil nuts and cashew nuts, fresh or dried, whether or not shelled or peeled" went up by $ 8.83 million (cumulative exports of commodity group 0801 from United Arab Emirates amounted $177 million in 2022)
Exports of commodity group 0801 "Coconuts, Brazil nuts and cashew nuts, fresh or dried, whether or not shelled or peeled" amounted to 0.032% of total exports from United Arab Emirates (cumulative merchandise exports from United Arab Emirates totalled $ 570 billion in 2023). The share of commodity group 0801 in total exports from United Arab Emirates decreased by 0.001 p.p. compared to 2022 (it was 0.034% in 2022 and cumulative exports from United Arab Emirates were equal to $ 515 billion).
Exports of commodity group 0801 amounted to 9.58% of total sales of group "" from United Arab Emirates in 2023 (the value of exports of commodity group from United Arab Emirates amounted to $1.94 billion in 2023). The share of exports of commodity group 0801 in sales of commodity group from United Arab Emirates lowered by 0.239 p.p. compared to 2022 (it was 9.82% in 2022, and exports of commodity group from United Arab Emirates were $1.8 billion).
Where does United Arab Emirates export Coconuts, Brazil nuts and cashew nuts, fresh or dried, whether or not shelled or peeled?
Top export destinations of "Coconuts, Brazil nuts and cashew nuts, fresh or dried, whether or not shelled or peeled" from United Arab Emirates in 2023:
- Iran with a share of 34% (64 million US$)
- Iraq with a share of 9.97% (18.5 million US$)
- India with a share of 9% (16.7 million US$)
- Vietnam with a share of 6.27% (11.6 million US$)
- Yemen with a share of 6.07% (11.3 million US$)
- Pakistan with a share of 5.31% (9.89 million US$)
- Oman with a share of 5.17% (9.61 million US$)
- Afghanistan with a share of 3.81% (7.09 million US$)
- Saudi Arabia with a share of 3.51% (6.53 million US$)
- Kuwait with a share of 2.28% (4.25 million US$)
Exports structure of 0801 - Coconuts, Brazil nuts and cashew nuts, fresh or dried, whether or not shelled or peeled - from United Arab Emirates in 2023 represented by the following main commodity groups:
- 87% (162 million US$): 080132 - Cashew nuts, shelled
- 5.03% (9.36 million US$): 080111 - Coconuts, desiccated
- 4.29% (7.99 million US$): 080119 - Cocunuts, other than desiccated
- 2.59% (4.82 million US$): 080131 - Cashew nuts, in shell
- 0.367% (684 thousand US$): 080122 - Brazil nuts, shelled
- 0.305% (569 thousand US$): 080121 - Brazil nuts, in shell
The value of imports of commodity group 0801 "Coconuts, Brazil nuts and cashew nuts, fresh or dried, whether or not shelled or peeled" to United Arab Emirates totalled $ 253 million in 2023. Sales of commodity group 0801 to United Arab Emirates went up by 9.3% compared to 2022: imports of commodity group 0801 "Coconuts, Brazil nuts and cashew nuts, fresh or dried, whether or not shelled or peeled" went up by $ 21 million (the value of imports of commodity group 0801 to United Arab Emirates was equal to $231 million in 2022)
Imports of commodity group 0801 "Coconuts, Brazil nuts and cashew nuts, fresh or dried, whether or not shelled or peeled" accounted for 0.053% of total import flow to United Arab Emirates (in 2023, total imports to United Arab Emirates amounted to $ 470 billion). The share of commodity group 0801 in total imports to United Arab Emirates decreased by 0.001 p.p. compared to 2022 (it was 0.055% in 2022 and cumulative imports to United Arab Emirates were equal to $ 420 billion).
Imports of commodity group 0801 reached 9.33% of total imports of group "" to United Arab Emirates in 2023 (imports of commodity group to United Arab Emirates totalled $2.71 billion in 2023). The share of purchases of commodity group 0801 in total imports of commodity group to United Arab Emirates increased by 0.21 p.p. compared to 2022 (it was 9.12% in 2022, and imports of commodity group to United Arab Emirates accounted for $2.53 billion).
Where does United Arab Emirates import Coconuts, Brazil nuts and cashew nuts, fresh or dried, whether or not shelled or peeled from?
Top trading partners (import of "Coconuts, Brazil nuts and cashew nuts, fresh or dried, whether or not shelled or peeled") of United Arab Emirates in 2023:
- India with a share of 48% (121 million US$)
- Vietnam with a share of 37% (95 million US$)
- Indonesia with a share of 3.45% (8.75 million US$)
- Sri Lanka with a share of 3.39% (8.59 million US$)
- Côte d`Ivoire with a share of 1.64% (4.15 million US$)
- Thailand with a share of 1.55% (3.93 million US$)
- Nigeria with a share of 1.38% (3.51 million US$)
- Mozambique - 1.96 million US$
- Benin - 1.64 million US$
- Brazil - 840 thousand US$
Imports structure of 0801 - Coconuts, Brazil nuts and cashew nuts, fresh or dried, whether or not shelled or peeled - to United Arab Emirates in 2023 represented by the following main commodity groups:
- 82% (210 million US$): 080132 - Cashew nuts, shelled
- 9.94% (25 million US$): 080119 - Cocunuts, other than desiccated
- 5.17% (13.1 million US$): 080111 - Coconuts, desiccated
- 0.486% (1.23 million US$): 080131 - Cashew nuts, in shell
- 0.402% (1.01 million US$): 080122 - Brazil nuts, shelled
- 0.062% (157 thousand US$): 080121 - Brazil nuts, in shell