Imports and Exports | World | Vegetable saps and extracts; pectic substances, pectinates and pectates, agar-agar and other mucilages and thickeners | Value (US$) and Value Growth, YoY (%) | 2002 - 2023
| Commodity | Reporter | Partner | Trade flow | Indicator | 2009 | 2010 | 2011 | 2012 | 2013 | 2014 | 2015 | 2016 | 2017 | 2018 | 2019 | 2020 |
| 1302. Vegetable saps and extracts; pectic substances, pectinates and pectates; agar-agar and other mucilages and thickeners, whether or not modified, derived from vegetable products | New Zealand | World | Exports | Value (US$) | 4,310,787.00 | 4,861,234.00 | 5,259,860.00 | 3,533,870.00 | 3,273,749.07 | 4,250,488.69 | 3,911,070.22 | 4,601,744.00 | 5,498,025.76 | 5,463,831.44 | 4,539,989.84 | 4,888,911.75 |
| Value Growth, YoY (%) | -17.34 | 12.76 | 8.20 | -32.81 | -7.36 | 29.83 | -7.98 | 17.65 | 19.47 | -0.62 | -16.90 | 7.68 | ||||
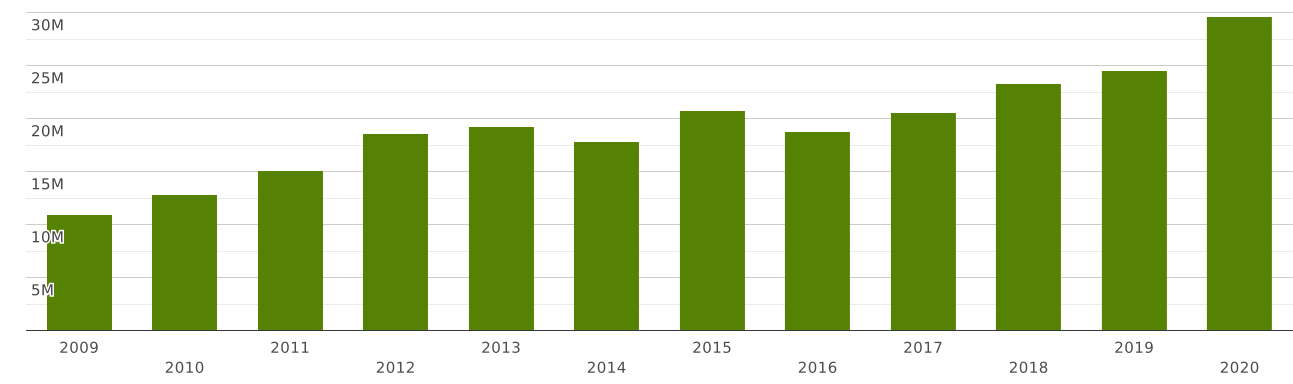
| Imports | Value (US$) | 10,978,394.00 | 12,819,280.00 | 15,108,474.00 | 18,568,020.00 | 19,219,998.49 | 17,810,158.65 | 20,765,063.70 | 18,814,763.00 | 20,573,528.02 | 23,260,185.63 | 24,496,938.03 | 29,608,226.68 | |||
| Value Growth, YoY (%) | -0.68 | 16.76 | 17.85 | 22.89 | 3.51 | -7.33 | 16.59 | -9.39 | 9.34 | 13.05 | 5.31 | 20.86 |
The value of exports of commodity group 1302 "Vegetable saps and extracts; pectic substances, pectinates and pectates; agar-agar and other mucilages and thickeners, whether or not modified, derived from vegetable products" from New Zealand totalled $ 4.88 million in 2020. Sales of commodity group 1302 from New Zealand went up by 7.68% compared to 2019: exports of commodity group 1302 "Vegetable saps and extracts; pectic substances, pectinates and pectates; agar-agar and other mucilages and thickeners, whether or not modified, derived from vegetable products" went up by $ 348 thousand (cumulative exports of commodity group 1302 from New Zealand amounted $4.53 million in 2019)
Exports of commodity group 1302 "Vegetable saps and extracts; pectic substances, pectinates and pectates; agar-agar and other mucilages and thickeners, whether or not modified, derived from vegetable products" amounted to 0.012% of total exports from New Zealand (cumulative merchandise exports from New Zealand totalled $ 38 billion in 2020). The share of commodity group 1302 in total exports from New Zealand increased by 0.001 p.p. compared to 2019 (it was 0.011% in 2019 and cumulative exports from New Zealand were equal to $ 39 billion).
Exports of commodity group 1302 amounted to 98% of total sales of group "" from New Zealand in 2020 (the value of exports of commodity group from New Zealand amounted to $4.97 million in 2020). The share of exports of commodity group 1302 in sales of commodity group from New Zealand lowered by 1.64 p.p. compared to 2019 (it was 99% in 2019, and exports of commodity group from New Zealand were $4.54 million).
Where does New Zealand export Vegetable saps and extracts; pectic substances, pectinates and pectates; agar-agar and other mucilages and thickeners, whether or not modified, derived from vegetable products?
Top export destinations of "Vegetable saps and extracts; pectic substances, pectinates and pectates; agar-agar and other mucilages and thickeners, whether or not modified, derived from vegetable products" from New Zealand in 2020:
- Australia with a share of 56% (2.77 million US$)
- India with a share of 8.56% (418 thousand US$)
- USA with a share of 8.41% (411 thousand US$)
- Malaysia with a share of 3.94% (192 thousand US$)
- Japan with a share of 3.01% (147 thousand US$)
- Fiji with a share of 2.69% (131 thousand US$)
- Hong Kong with a share of 2.45% (119 thousand US$)
- Other Asia, nes with a share of 2.4% (117 thousand US$)
- China with a share of 2.32% (113 thousand US$)
- Korea with a share of 1.73% (84 thousand US$)
Exports structure of 1302 - Vegetable saps and extracts; pectic substances, pectinates and pectates; agar-agar and other mucilages and thickeners, whether or not modified, derived from vegetable products - from New Zealand in 2020 represented by the following main commodity groups:
- 92% (4.52 million US$): 130219 - Vegetable saps & extracts (n.e.s. in item no. 1302.1)
- 2.85% (139 thousand US$): 130232 - Mucilages & thickeners, whether or not modified, derived from locust beans/locust bean seeds/guar seeds
- 1.61% (78 thousand US$): 130213 - Saps & extracts of hops
- 1.15% (56 thousand US$): 130231 - Agar-agar
- 0.8% (39 thousand US$): 130212 - Saps & extracts of liquorice
- 0.752% (36 thousand US$): 130239 - Mucilages and thickeners; whether or not modified, derived from vegetable products, n.e.s. in item no. 1302.3
- 0.246% (12 thousand US$): 130220 - Pectic subs., pectinates & pectates
The value of imports of commodity group 1302 "Vegetable saps and extracts; pectic substances, pectinates and pectates; agar-agar and other mucilages and thickeners, whether or not modified, derived from vegetable products" to New Zealand totalled $ 29 million in 2020. Sales of commodity group 1302 to New Zealand went up by 20% compared to 2019: imports of commodity group 1302 "Vegetable saps and extracts; pectic substances, pectinates and pectates; agar-agar and other mucilages and thickeners, whether or not modified, derived from vegetable products" went up by $ 5.11 million (the value of imports of commodity group 1302 to New Zealand was equal to $24 million in 2019)
Imports of commodity group 1302 "Vegetable saps and extracts; pectic substances, pectinates and pectates; agar-agar and other mucilages and thickeners, whether or not modified, derived from vegetable products" accounted for 0.079% of total import flow to New Zealand (in 2020, total imports to New Zealand amounted to $ 37 billion). The share of commodity group 1302 in total imports to New Zealand increased by 0.021 p.p. compared to 2019 (it was 0.057% in 2019 and cumulative imports to New Zealand were equal to $ 42 billion).
Imports of commodity group 1302 reached 97% of total imports of group "" to New Zealand in 2020 (imports of commodity group to New Zealand totalled $30 million in 2020). The share of purchases of commodity group 1302 in total imports of commodity group to New Zealand increased by 0.625 p.p. compared to 2019 (it was 97% in 2019, and imports of commodity group to New Zealand accounted for $25 million).
Where does New Zealand import Vegetable saps and extracts; pectic substances, pectinates and pectates; agar-agar and other mucilages and thickeners, whether or not modified, derived from vegetable products from?
Top trading partners (import of "Vegetable saps and extracts; pectic substances, pectinates and pectates; agar-agar and other mucilages and thickeners, whether or not modified, derived from vegetable products") of New Zealand in 2020:
- China with a share of 22% (6.56 million US$)
- Spain with a share of 15.8% (4.69 million US$)
- India with a share of 11.9% (3.54 million US$)
- Australia with a share of 9.8% (2.9 million US$)
- USA with a share of 7.47% (2.21 million US$)
- Philippines with a share of 6.4% (1.89 million US$)
- Germany with a share of 5.47% (1.62 million US$)
- France with a share of 4.92% (1.45 million US$)
- Italy with a share of 3.28% (971 thousand US$)
- Other Asia, nes with a share of 3.15% (933 thousand US$)
Imports structure of 1302 - Vegetable saps and extracts; pectic substances, pectinates and pectates; agar-agar and other mucilages and thickeners, whether or not modified, derived from vegetable products - to New Zealand in 2020 represented by the following main commodity groups:
- 57% (16.9 million US$): 130219 - Vegetable saps & extracts (n.e.s. in item no. 1302.1)
- 19.3% (5.72 million US$): 130232 - Mucilages & thickeners, whether or not modified, derived from locust beans/locust bean seeds/guar seeds
- 13% (3.85 million US$): 130239 - Mucilages and thickeners; whether or not modified, derived from vegetable products, n.e.s. in item no. 1302.3
- 7.45% (2.2 million US$): 130220 - Pectic subs., pectinates & pectates
- 1.36% (404 thousand US$): 130213 - Saps & extracts of hops
- 1.05% (311 thousand US$): 130212 - Saps & extracts of liquorice
- 0.53% (156 thousand US$): 130231 - Agar-agar
- 0.012% (3.68 thousand US$): 130214 - Vegetable saps and extracts; of ephedra