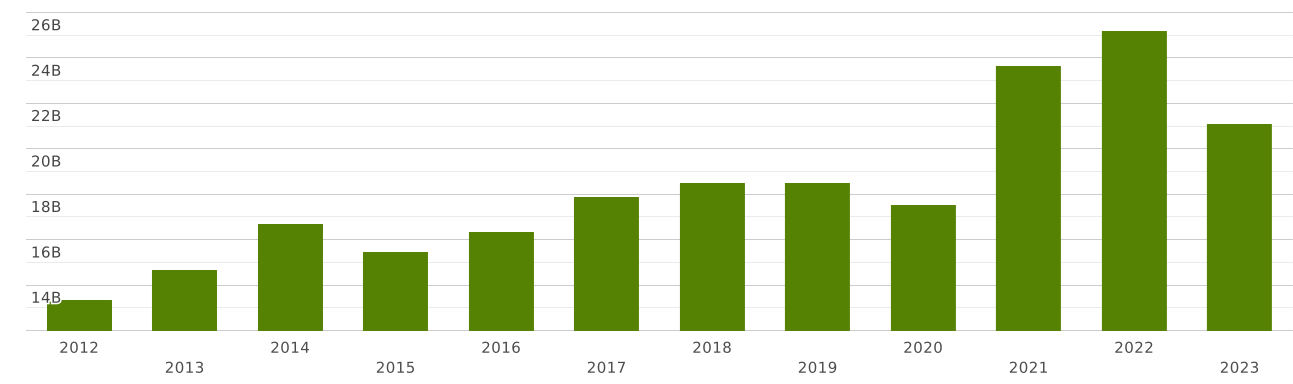
USA | Imports and Exports | World | Fish and crustaceans, molluscs and other aquatic invertebrates | Value (US$) and Value Growth, YoY (%) | 2012 - 2023
The value of exports of commodity group 03 "Fish and crustaceans, molluscs and other aquatic invertebrates" from USA totalled $ 4.7 billion in 2023. Sales of commodity group 03 from USA decreased by 7.24% in value terms compared to 2022. exports of commodity group 03 "Fish and crustaceans, molluscs and other aquatic invertebrates" decreased by $ 367 million (cumulative exports of commodity group 03 from USA amounted $5.07 billion in 2022)
Exports of commodity group 03 "Fish and crustaceans, molluscs and other aquatic invertebrates" amounted to 0.233% of total exports from USA (cumulative merchandise exports from USA totalled $ 2.01 trillion in 2023). The share of commodity group 03 in total exports from USA decreased by 0.012 p.p. compared to 2022 (it was 0.246% in 2022 and cumulative exports from USA were equal to $ 2.06 trillion).
Where does USA export Fish and crustaceans, molluscs and other aquatic invertebrates?
Top export destinations of "Fish and crustaceans, molluscs and other aquatic invertebrates" from USA in 2023:
- Canada with a share of 22% (1.06 billion US$)
- China with a share of 19.2% (907 million US$)
- Japan with a share of 13.6% (644 million US$)
- Korea with a share of 9.75% (459 million US$)
- Netherlands with a share of 7.52% (354 million US$)
- Hong Kong with a share of 2.96% (139 million US$)
- Lithuania with a share of 2.33% (110 million US$)
- France with a share of 2.08% (98 million US$)
- Germany with a share of 1.87% (88 million US$)
- Italy with a share of 1.76% (83 million US$)
Exports structure of 03 - Fish and crustaceans, molluscs and other aquatic invertebrates - from USA in 2023 represented by the following main commodity groups:
- 36% (1.71 billion US$): 0303 - Fish, frozen, excluding fish fillets and other fish meat of heading 03.04.
- 28% (1.33 billion US$): 0304 - Fish fillets and other fish meat (whether or not minced), fresh, chilled or frozen.
- 20% (982 million US$): 0306 - Crustaceans; in shell or not, live, fresh, chilled, frozen, dried, salted or in brine; smoked, cooked or not before or during smoking; in shell, steamed or boiled, whether or not chilled, frozen, dried, salted or in brine
- 7.9% (372 million US$): 0307 - Molluscs; whether in shell or not, live, fresh, chilled, frozen, dried, salted or in brine; smoked molluscs, whether in shell or not, whether or not cooked before or during the smoking process
- 4.2% (197 million US$): 0302 - Fish, fresh or chilled, excluding fish fillets and other fish meat of heading 0304
- 1.16% (55 million US$): 0301 - Live fish.
- 0.538% (25 million US$): 0305 - Fish, dried, salted or in brine; smoked fish, whether or not cooked before, or during the smoking process
The value of imports of commodity group 03 "Fish and crustaceans, molluscs and other aquatic invertebrates" to USA totalled $ 21 billion in 2023. Sales of commodity group 03 to USA decreased by 16% in value terms compared to 2022. imports of commodity group 03 "Fish and crustaceans, molluscs and other aquatic invertebrates" decreased by $ 4.05 billion (the value of imports of commodity group 03 to USA was equal to $25 billion in 2022)
Imports of commodity group 03 "Fish and crustaceans, molluscs and other aquatic invertebrates" accounted for 0.667% of total import flow to USA (in 2023, total imports to USA amounted to $ 3.16 trillion). The share of commodity group 03 in total imports to USA decreased by 0.079 p.p. compared to 2022 (it was 0.746% in 2022 and cumulative imports to USA were equal to $ 3.37 trillion).
Where does USA import Fish and crustaceans, molluscs and other aquatic invertebrates from?
Top trading partners (import of "Fish and crustaceans, molluscs and other aquatic invertebrates") of USA in 2023:
- Chile with a share of 16.6% (3.5 billion US$)
- Canada with a share of 14.7% (3.12 billion US$)
- India with a share of 9.61% (2.03 billion US$)
- Ecuador with a share of 7.18% (1.51 billion US$)
- Norway with a share of 7.03% (1.48 billion US$)
- China with a share of 6.21% (1.31 billion US$)
- Indonesia with a share of 5.7% (1.2 billion US$)
- Vietnam with a share of 4.39% (929 million US$)
- Mexico with a share of 2.55% (540 million US$)
- Japan with a share of 2.06% (435 million US$)
Imports structure of 03 - Fish and crustaceans, molluscs and other aquatic invertebrates - to USA in 2023 represented by the following main commodity groups:
- 40% (8.52 billion US$): 0304 - Fish fillets and other fish meat (whether or not minced), fresh, chilled or frozen.
- 33% (7.15 billion US$): 0306 - Crustaceans; in shell or not, live, fresh, chilled, frozen, dried, salted or in brine; smoked, cooked or not before or during smoking; in shell, steamed or boiled, whether or not chilled, frozen, dried, salted or in brine
- 13.1% (2.77 billion US$): 0302 - Fish, fresh or chilled, excluding fish fillets and other fish meat of heading 0304
- 5.63% (1.19 billion US$): 0307 - Molluscs; whether in shell or not, live, fresh, chilled, frozen, dried, salted or in brine; smoked molluscs, whether in shell or not, whether or not cooked before or during the smoking process
- 4.31% (911 million US$): 0303 - Fish, frozen, excluding fish fillets and other fish meat of heading 03.04.
- 1.89% (401 million US$): 0305 - Fish, dried, salted or in brine; smoked fish, whether or not cooked before, or during the smoking process
- 0.586% (123 million US$): 0301 - Live fish.