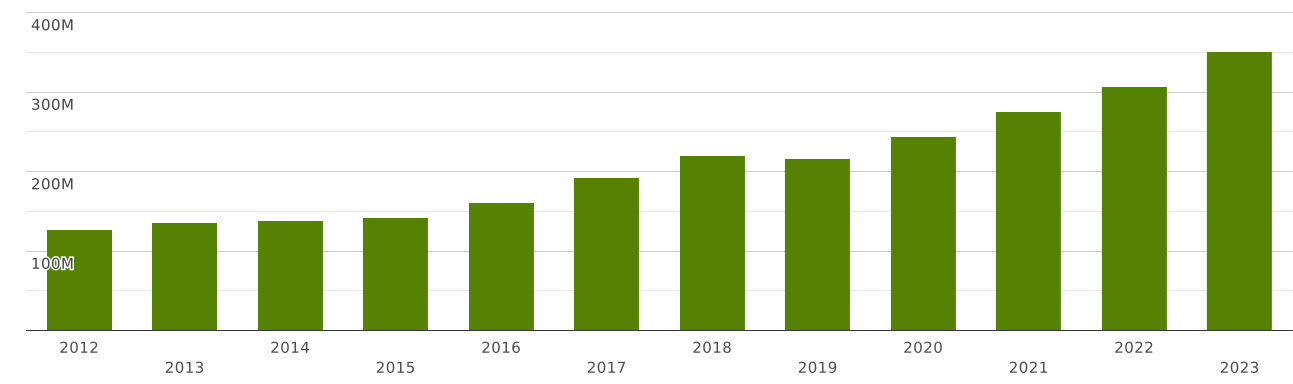
USA | Imports and Exports | World | Fresh fruit, n.e.s. | Value (US$) and Value Growth, YoY (%) | 2012 - 2023
The value of exports of commodity group 081090 "Fresh fruit, n.e.s." from USA totalled $ 62 million in 2023. Sales of commodity group 081090 from USA went up by 1.88% compared to 2022: exports of commodity group 081090 "Fresh fruit, n.e.s." went up by $ 1.15 million (cumulative exports of commodity group 081090 from USA amounted $61 million in 2022)
Exports of commodity group 081090 "Fresh fruit, n.e.s." amounted to 0.003% of total exports from USA (cumulative merchandise exports from USA totalled $ 2.01 trillion in 2023). The share of commodity group 081090 in total exports from USA decreased by 0 p.p. compared to 2022 (it was 0.002% in 2022 and cumulative exports from USA were equal to $ 2.06 trillion).
Exports of commodity group 081090 amounted to 0.419% of total sales of group "" from USA in 2023 (the value of exports of commodity group from USA amounted to $14.8 billion in 2023). The share of exports of commodity group 081090 in sales of commodity group from USA increased by 0.004 p.p. compared to 2022 (it was 0.414% in 2022, and exports of commodity group from USA were $14.7 billion).
Exports of commodity group 081090 amounted to 4.32 percent of total sales of group "" from USA in 2023 (the value of exports of commodity group from USA amounted to 1.44 billion USD in 2023). The share of exports of commodity group 081090 in sales of commodity group from USA increased by 0.017 p.p. compared to 2022 (it was 4.3 percent in 2022, and exports of commodity group from USA amounted to 1.42 billion USD).
Where does USA export Fresh fruit, n.e.s.?
Top export destinations of "Fresh fruit, n.e.s." from USA in 2023:
- Canada with a share of 64% (40 million US$)
- Korea with a share of 14.9% (9.31 million US$)
- Australia with a share of 4.29% (2.67 million US$)
- Mexico with a share of 4.23% (2.63 million US$)
- Other Asia, nes with a share of 2.95% (1.84 million US$)
- Japan with a share of 2.27% (1.41 million US$)
- New Zealand with a share of 1.18% (739 thousand US$)
- Federated States of Micronesia with a share of 1.04% (650 thousand US$)
- China - 430 thousand US$
- Dominican Republic - 330 thousand US$
The value of imports of commodity group 081090 "Fresh fruit, n.e.s." to USA totalled $ 350 million in 2023. Sales of commodity group 081090 to USA went up by 14.4% compared to 2022: imports of commodity group 081090 "Fresh fruit, n.e.s." went up by $ 44 million (the value of imports of commodity group 081090 to USA was equal to $306 million in 2022)
Imports of commodity group 081090 "Fresh fruit, n.e.s." accounted for 0.011% of total import flow to USA (in 2023, total imports to USA amounted to $ 3.16 trillion). The share of commodity group 081090 in total imports to USA increased by 0.001 p.p. compared to 2022 (it was 0.009% in 2022 and cumulative imports to USA were equal to $ 3.37 trillion).
Imports of commodity group 081090 reached 1.44% of total imports of group "" to USA in 2023 (imports of commodity group to USA totalled $24 billion in 2023). The share of purchases of commodity group 081090 in total imports of commodity group to USA increased by 0.177 p.p. compared to 2022 (it was 1.26% in 2022, and imports of commodity group to USA accounted for $24 billion).
Imports of commodity group 081090 reached 6.06 percent of total imports of group "" to USA in 2023 (imports of commodity group to USA totalled 5.78 billion USD in 2023). The share of purchases of commodity group 081090 in total imports of commodity group to USA increased by 0.507 p.p. compared to 2022 (it was 5.55 percent in 2022, and imports of commodity group to USA accounted for 5.51 billion USD).
Where does USA import Fresh fruit, n.e.s. from?
Top trading partners (import of "Fresh fruit, n.e.s.") of USA in 2023:
- Mexico with a share of 47% (167 million US$)
- Ecuador with a share of 25% (88 million US$)
- Peru with a share of 5.41% (18.9 million US$)
- Vietnam with a share of 3.7% (13 million US$)
- Guatemala with a share of 3.17% (11.1 million US$)
- Chile with a share of 2.75% (9.66 million US$)
- Thailand with a share of 2.41% (8.46 million US$)
- South Africa with a share of 1.44% (5.07 million US$)
- Israel with a share of 1.39% (4.88 million US$)
- Argentina with a share of 1.33% (4.67 million US$)