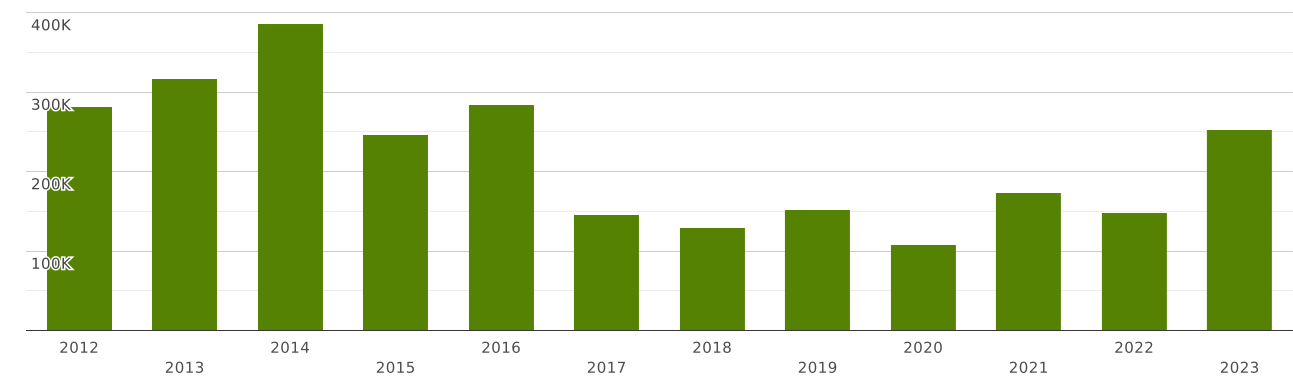
USA | Imports and Exports | World | Raw silk (not thrown) | Value (US$) and Value Growth, YoY (%) | 2012 - 2023
The value of exports of commodity group 5002 "Raw silk (not thrown)" from USA totalled $ 705 thousand in 2023. Sales of commodity group 5002 from USA went up by 273% compared to 2022: exports of commodity group 5002 "Raw silk (not thrown)" went up by $ 516 thousand (cumulative exports of commodity group 5002 from USA amounted $189 thousand in 2022)
Exports of commodity group 5002 amounted to 10.6% of total sales of group "" from USA in 2023 (the value of exports of commodity group from USA amounted to $6.62 million in 2023). The share of exports of commodity group 5002 in sales of commodity group from USA increased by 7.18 p.p. compared to 2022 (it was 3.47% in 2022, and exports of commodity group from USA were $5.44 million).
Where does USA export Raw silk (not thrown)?
Top export destinations of "Raw silk (not thrown)" from USA in 2023:
- India with a share of 65% (458 thousand US$)
- Ghana with a share of 14.1% (100 thousand US$)
- Colombia with a share of 5.86% (41 thousand US$)
- Peru with a share of 3.56% (25 thousand US$)
- France with a share of 3% (21 thousand US$)
- Canada with a share of 2.42% (17.1 thousand US$)
- Sri Lanka with a share of 1.94% (13.7 thousand US$)
- Korea with a share of 1.4% (9.9 thousand US$)
- British Virgin Islands with a share of 1.16% (8.22 thousand US$)
- Switzerland - 6.51 thousand US$
Exports structure of 5002 - Raw silk (not thrown) - from USA in 2023 represented by the following main commodity groups:
- 100% (705 thousand US$): 500200 - Raw silk (not thrown)
The value of imports of commodity group 5002 "Raw silk (not thrown)" to USA totalled $ 253 thousand in 2023. Sales of commodity group 5002 to USA went up by 70% compared to 2022: imports of commodity group 5002 "Raw silk (not thrown)" went up by $ 104 thousand (the value of imports of commodity group 5002 to USA was equal to $148 thousand in 2022)
Imports of commodity group 5002 reached 0.427% of total imports of group "" to USA in 2023 (imports of commodity group to USA totalled $59 million in 2023). The share of purchases of commodity group 5002 in total imports of commodity group to USA increased by 0.221 p.p. compared to 2022 (it was 0.206% in 2022, and imports of commodity group to USA accounted for $71 million).
Where does USA import Raw silk (not thrown) from?
Top trading partners (import of "Raw silk (not thrown)") of USA in 2023:
- Switzerland with a share of 72% (183 thousand US$)
- Italy with a share of 8.14% (20 thousand US$)
- United Kingdom with a share of 6.12% (15.5 thousand US$)
- Peru with a share of 6.09% (15.4 thousand US$)
- China with a share of 2.59% (6.57 thousand US$)
- India with a share of 2.44% (6.18 thousand US$)
- Poland with a share of 1.9% (4.81 thousand US$)
Imports structure of 5002 - Raw silk (not thrown) - to USA in 2023 represented by the following main commodity groups:
- 100% (253 thousand US$): 500200 - Raw silk (not thrown)