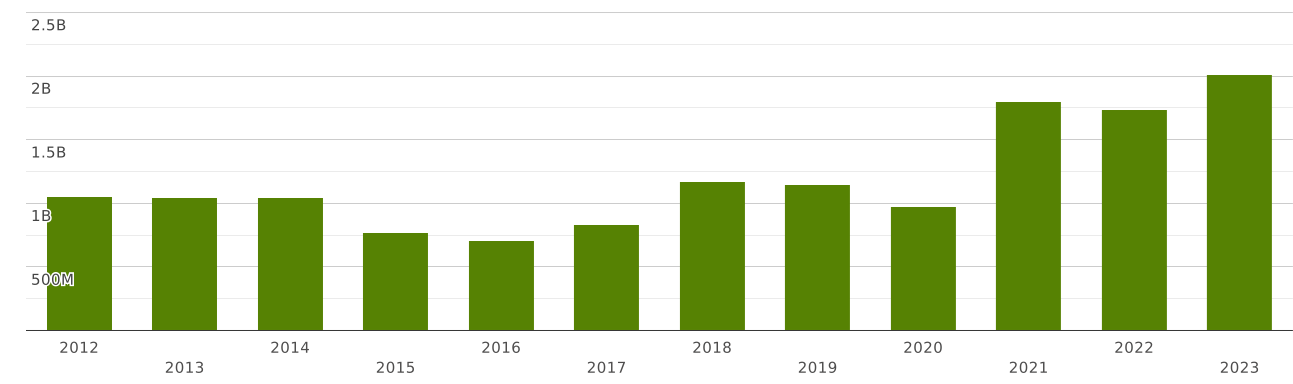
USA | Imports and Exports | World | Copper wire, of ref. copper of which the maximum cross-sectional dim. exceeds 6mm | Value (US$) and Value Growth, YoY (%) | 2012 - 2023
The value of exports of commodity group 740811 "Copper wire, of ref. copper of which the maximum cross-sectional dim. exceeds 6mm" from USA totalled $ 1.34 billion in 2023. Sales of commodity group 740811 from USA went up by 5.88% compared to 2022: exports of commodity group 740811 "Copper wire, of ref. copper of which the maximum cross-sectional dim. exceeds 6mm" went up by $ 74 million (cumulative exports of commodity group 740811 from USA amounted $1.27 billion in 2022)
Exports of commodity group 740811 "Copper wire, of ref. copper of which the maximum cross-sectional dim. exceeds 6mm" amounted to 0.066% of total exports from USA (cumulative merchandise exports from USA totalled $ 2.01 trillion in 2023). The share of commodity group 740811 in total exports from USA increased by 0.005 p.p. compared to 2022 (it was 0.061% in 2022 and cumulative exports from USA were equal to $ 2.06 trillion).
Exports of commodity group 740811 amounted to 12.2% of total sales of group "" from USA in 2023 (the value of exports of commodity group from USA amounted to $10.9 billion in 2023). The share of exports of commodity group 740811 in sales of commodity group from USA lowered by 0.355 p.p. compared to 2022 (it was 12.6% in 2022, and exports of commodity group from USA were $10 billion).
Exports of commodity group 740811 amounted to 85 percent of total sales of group "" from USA in 2023 (the value of exports of commodity group from USA amounted to 1.57 billion USD in 2023). The share of exports of commodity group 740811 in sales of commodity group from USA lowered by 0.11 p.p. compared to 2022 (it was 85 percent in 2022, and exports of commodity group from USA amounted to 1.48 billion USD).
Where does USA export Copper wire, of ref. copper of which the maximum cross-sectional dim. exceeds 6mm?
Top export destinations of "Copper wire, of ref. copper of which the maximum cross-sectional dim. exceeds 6mm" from USA in 2023:
- Mexico with a share of 78% (1.05 billion US$)
- Canada with a share of 21% (288 million US$)
- Brazil - 370 thousand US$
- Spain - 324 thousand US$
- India - 266 thousand US$
- France - 206 thousand US$
- Hong Kong - 206 thousand US$
- Singapore - 191 thousand US$
- Latvia - 156 thousand US$
- Japan - 109 thousand US$
The value of imports of commodity group 740811 "Copper wire, of ref. copper of which the maximum cross-sectional dim. exceeds 6mm" to USA totalled $ 2.01 billion in 2023. Sales of commodity group 740811 to USA went up by 15.8% compared to 2022: imports of commodity group 740811 "Copper wire, of ref. copper of which the maximum cross-sectional dim. exceeds 6mm" went up by $ 276 million (the value of imports of commodity group 740811 to USA was equal to $1.74 billion in 2022)
Imports of commodity group 740811 "Copper wire, of ref. copper of which the maximum cross-sectional dim. exceeds 6mm" accounted for 0.063% of total import flow to USA (in 2023, total imports to USA amounted to $ 3.16 trillion). The share of commodity group 740811 in total imports to USA increased by 0.012 p.p. compared to 2022 (it was 0.051% in 2022 and cumulative imports to USA were equal to $ 3.37 trillion).
Imports of commodity group 740811 reached 13.8% of total imports of group "" to USA in 2023 (imports of commodity group to USA totalled $14.5 billion in 2023). The share of purchases of commodity group 740811 in total imports of commodity group to USA increased by 2.69 p.p. compared to 2022 (it was 11.1% in 2022, and imports of commodity group to USA accounted for $15.5 billion).
Imports of commodity group 740811 reached 81 percent of total imports of group "" to USA in 2023 (imports of commodity group to USA totalled 2.48 billion USD in 2023). The share of purchases of commodity group 740811 in total imports of commodity group to USA increased by 3.24 p.p. compared to 2022 (it was 78 percent in 2022, and imports of commodity group to USA accounted for 2.23 billion USD).
Where does USA import Copper wire, of ref. copper of which the maximum cross-sectional dim. exceeds 6mm from?
Top trading partners (import of "Copper wire, of ref. copper of which the maximum cross-sectional dim. exceeds 6mm") of USA in 2023:
- Canada with a share of 76% (1.53 billion US$)
- United Arab Emirates with a share of 6.41% (129 million US$)
- Mexico with a share of 6.4% (129 million US$)
- Korea with a share of 4.05% (81 million US$)
- Chile with a share of 2.59% (52 million US$)
- Uzbekistan with a share of 2.15% (43 million US$)
- Peru - 17.6 million US$
- Japan - 9.85 million US$
- Germany - 6.75 million US$
- Finland - 4.52 million US$