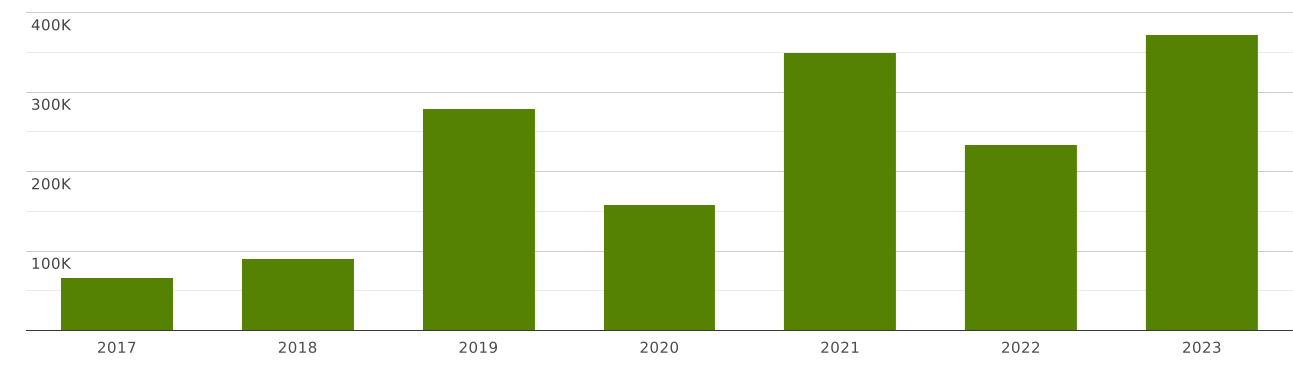
Uzbekistan | Imports and Exports | World | Frozen Vegetables | Value (US$) and Value Growth, YoY (%) | 2017 - 2023
| Commodity | Reporter | Partner | Trade flow | Indicator | 2017 | 2018 | 2019 | 2020 | 2021 | 2022 | 2023 |
| 0710. Vegetables (uncooked or cooked by steaming or boiling in water), frozen | Uzbekistan | World | Exports | Value (US$) | 2,138,728.00 | 2,392,991.00 | 2,227,780.96 | 4,050,477.00 | 9,492,943.99 | 16,608,765.98 | 14,047,030.98 |
| Value Growth, YoY (%) | 11.88 | -6.90 | 81.81 | 134.36 | 74.95 | -15.42 | |||||
| Imports | Value (US$) | 66,844.00 | 90,666.00 | 279,209.00 | 158,667.00 | 349,433.99 | 234,077.00 | 372,879.00 | |||
| Value Growth, YoY (%) | 35.63 | 207.95 | -43.17 | 120.23 | -33.01 | 59.29 |
The value of exports of commodity group 0710 "Vegetables (uncooked or cooked by steaming or boiling in water), frozen" from Uzbekistan totalled $ 14 million in 2023. Sales of commodity group 0710 from Uzbekistan decreased by 15.4% in value terms compared to 2022. exports of commodity group 0710 "Vegetables (uncooked or cooked by steaming or boiling in water), frozen" decreased by $ 2.56 million (cumulative exports of commodity group 0710 from Uzbekistan amounted $16.6 million in 2022)
Exports of commodity group 0710 "Vegetables (uncooked or cooked by steaming or boiling in water), frozen" amounted to 0.066% of total exports from Uzbekistan (cumulative merchandise exports from Uzbekistan totalled $ 21 billion in 2023). The share of commodity group 0710 in total exports from Uzbekistan decreased by 0.041 p.p. compared to 2022 (it was 0.108% in 2022 and cumulative exports from Uzbekistan were equal to $ 15.2 billion).
Exports of commodity group 0710 amounted to 2.3% of total sales of group "" from Uzbekistan in 2023 (the value of exports of commodity group from Uzbekistan amounted to $608 million in 2023). The share of exports of commodity group 0710 in sales of commodity group from Uzbekistan lowered by 1.16 p.p. compared to 2022 (it was 3.47% in 2022, and exports of commodity group from Uzbekistan were $478 million).
Where does Uzbekistan export Vegetables (uncooked or cooked by steaming or boiling in water), frozen?
Top export destinations of "Vegetables (uncooked or cooked by steaming or boiling in water), frozen" from Uzbekistan in 2023:
- Russia with a share of 97% (13.7 million US$)
- Belarus with a share of 1.38% (194 thousand US$)
- Kazakhstan - 116 thousand US$
- Poland - 21 thousand US$
- Kyrgyz Republic - 528 US$
- United Arab Emirates - 12 US$
Exports structure of 0710 - Vegetables (uncooked or cooked by steaming or boiling in water), frozen - from Uzbekistan in 2023 represented by the following main commodity groups:
- 98% (13.8 million US$): 071080 - Vegetables, n.e.s., uncooked/cooked by steaming/boiling in water, n.e.s. in heading no. 0710, frozen
- 1.25% (176 thousand US$): 071040 - Sweet corn, uncooked/cooked by steaming/boiling in water, frozen
- 0.117% (16.4 thousand US$): 071030 - Spinach, New Zealand spinach & orache spinach (garden spinach), uncooked/cooked by steaming/boiling in water, frozen
- 0.086% (12.1 thousand US$): 071029 - Leguminous vegetables (excl. of 0710.21 & 0710.22), shelled/unshelled, uncooked/cooked by steaming/boiling in water, frozen
- 0.005% (767 US$): 071090 - Mixtures of vegetables, uncooked/cooked by steaming/boiling in water, frozen
The value of imports of commodity group 0710 "Vegetables (uncooked or cooked by steaming or boiling in water), frozen" to Uzbekistan totalled $ 372 thousand in 2023. Sales of commodity group 0710 to Uzbekistan went up by 59% compared to 2022: imports of commodity group 0710 "Vegetables (uncooked or cooked by steaming or boiling in water), frozen" went up by $ 138 thousand (the value of imports of commodity group 0710 to Uzbekistan was equal to $234 thousand in 2022)
Imports of commodity group 0710 "Vegetables (uncooked or cooked by steaming or boiling in water), frozen" accounted for 0.001% of total import flow to Uzbekistan (in 2023, total imports to Uzbekistan amounted to $ 36 billion). The share of commodity group 0710 in total imports to Uzbekistan decreased by 0 p.p. compared to 2022 (it was 0% in 2022 and cumulative imports to Uzbekistan were equal to $ 28 billion).
Imports of commodity group 0710 reached 0.454% of total imports of group "" to Uzbekistan in 2023 (imports of commodity group to Uzbekistan totalled $81 million in 2023). The share of purchases of commodity group 0710 in total imports of commodity group to Uzbekistan increased by 0.216 p.p. compared to 2022 (it was 0.238% in 2022, and imports of commodity group to Uzbekistan accounted for $98 million).
Where does Uzbekistan import Vegetables (uncooked or cooked by steaming or boiling in water), frozen from?
Top trading partners (import of "Vegetables (uncooked or cooked by steaming or boiling in water), frozen") of Uzbekistan in 2023:
- Moldova with a share of 76% (286 thousand US$)
- Poland with a share of 7.91% (29 thousand US$)
- Russia with a share of 5.28% (19.7 thousand US$)
- China with a share of 4.98% (18.5 thousand US$)
- Turkey with a share of 3.93% (14.6 thousand US$)
- Serbia - 1.17 thousand US$
- Egypt - 1.06 thousand US$
- Kazakhstan - 763 US$
- Chile - 606 US$
- Spain - 91 US$
Imports structure of 0710 - Vegetables (uncooked or cooked by steaming or boiling in water), frozen - to Uzbekistan in 2023 represented by the following main commodity groups:
- 54% (202 thousand US$): 071021 - Peas (Pisum sativum), shelled/unshelled, uncooked/cooked by steaming/boiling in water, frozen
- 25% (95 thousand US$): 071040 - Sweet corn, uncooked/cooked by steaming/boiling in water, frozen
- 9.74% (36 thousand US$): 071080 - Vegetables, n.e.s., uncooked/cooked by steaming/boiling in water, n.e.s. in heading no. 0710, frozen
- 4.34% (16.1 thousand US$): 071090 - Mixtures of vegetables, uncooked/cooked by steaming/boiling in water, frozen
- 2.69% (10 thousand US$): 071022 - Beans (Vigna spp., Phaseolus spp.), shelled/unshelled, uncooked/cooked by steaming/boiling in water, frozen
- 1.56% (5.82 thousand US$): 071030 - Spinach, New Zealand spinach & orache spinach (garden spinach), uncooked/cooked by steaming/boiling in water, frozen
- 1.54% (5.76 thousand US$): 071029 - Leguminous vegetables (excl. of 0710.21 & 0710.22), shelled/unshelled, uncooked/cooked by steaming/boiling in water, frozen
- 0.196% (733 US$): 071010 - Potatoes, uncooked/cooked by steaming/boiling in water, frozen