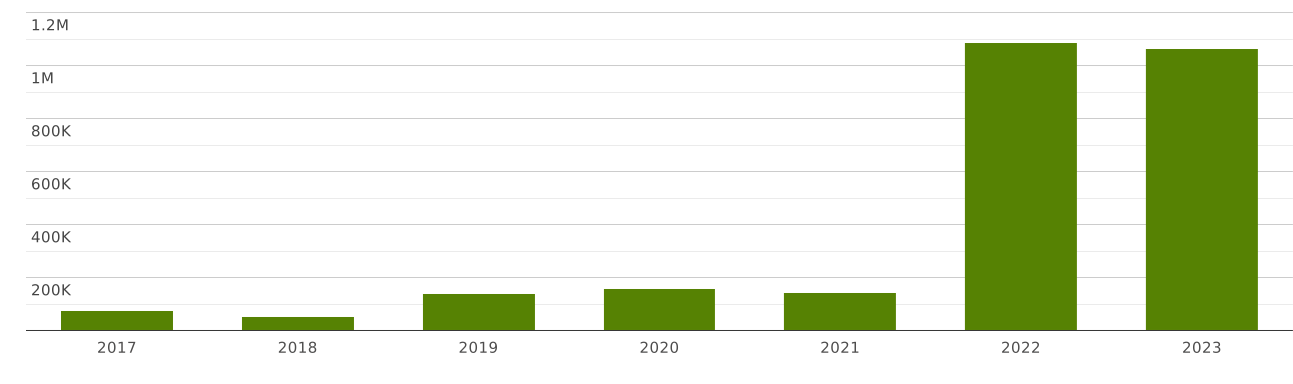
Uzbekistan | Imports and Exports | World | Dried Fruits, mixtures of nuts or dried fruits | Value (US$) and Value Growth, YoY (%) | 2017 - 2023
The value of exports of commodity group 0813 "Fruit, dried, other than that of headings Nos. 08.01 to 08.06; mixtures of nuts or dried fruits of this Chapter" from Uzbekistan totalled $ 87 million in 2023. Sales of commodity group 0813 from Uzbekistan went up by 65% compared to 2022: exports of commodity group 0813 "Fruit, dried, other than that of headings Nos. 08.01 to 08.06; mixtures of nuts or dried fruits of this Chapter" went up by $ 34 million (cumulative exports of commodity group 0813 from Uzbekistan amounted $52 million in 2022)
Exports of commodity group 0813 "Fruit, dried, other than that of headings Nos. 08.01 to 08.06; mixtures of nuts or dried fruits of this Chapter" amounted to 0.414% of total exports from Uzbekistan (cumulative merchandise exports from Uzbekistan totalled $ 21 billion in 2023). The share of commodity group 0813 in total exports from Uzbekistan increased by 0.069 p.p. compared to 2022 (it was 0.344% in 2022 and cumulative exports from Uzbekistan were equal to $ 15.2 billion).
Exports of commodity group 0813 amounted to 14.6% of total sales of group "" from Uzbekistan in 2023 (the value of exports of commodity group from Uzbekistan amounted to $594 million in 2023). The share of exports of commodity group 0813 in sales of commodity group from Uzbekistan increased by 6.14 p.p. compared to 2022 (it was 8.52% in 2022, and exports of commodity group from Uzbekistan were $618 million).
Where does Uzbekistan export Fruit, dried, other than that of headings Nos. 08.01 to 08.06; mixtures of nuts or dried fruits of this Chapter?
Top export destinations of "Fruit, dried, other than that of headings Nos. 08.01 to 08.06; mixtures of nuts or dried fruits of this Chapter" from Uzbekistan in 2023:
- China with a share of 27% (23 million US$)
- Russia with a share of 21% (19 million US$)
- Kazakhstan with a share of 13.4% (11.7 million US$)
- Turkey with a share of 9.88% (8.61 million US$)
- Belarus with a share of 4.27% (3.72 million US$)
- Lithuania with a share of 3.86% (3.36 million US$)
- Ukraine with a share of 2.9% (2.53 million US$)
- Israel with a share of 1.75% (1.52 million US$)
- Azerbaijan with a share of 1.58% (1.38 million US$)
- Latvia with a share of 1.54% (1.34 million US$)
Exports structure of 0813 - Fruit, dried, other than that of headings Nos. 08.01 to 08.06; mixtures of nuts or dried fruits of this Chapter - from Uzbekistan in 2023 represented by the following main commodity groups:
- 56% (49 million US$): 081320 - Prunes, dried
- 22% (19.7 million US$): 081310 - Apricots, dried
- 8.51% (7.42 million US$): 081350 - Mixtures of nuts or dried fruits of Ch.8
- 6.61% (5.76 million US$): 081340 - Dried fruit (excl. of 0812)
- 5.49% (4.79 million US$): 081330 - Apples, dried
The value of imports of commodity group 0813 "Fruit, dried, other than that of headings Nos. 08.01 to 08.06; mixtures of nuts or dried fruits of this Chapter" to Uzbekistan totalled $ 1.06 million in 2023. Sales of commodity group 0813 to Uzbekistan decreased by 1.88% in value terms compared to 2022. imports of commodity group 0813 "Fruit, dried, other than that of headings Nos. 08.01 to 08.06; mixtures of nuts or dried fruits of this Chapter" decreased by $ 20 thousand (the value of imports of commodity group 0813 to Uzbekistan was equal to $1.08 million in 2022)
Imports of commodity group 0813 "Fruit, dried, other than that of headings Nos. 08.01 to 08.06; mixtures of nuts or dried fruits of this Chapter" accounted for 0.002% of total import flow to Uzbekistan (in 2023, total imports to Uzbekistan amounted to $ 36 billion). The share of commodity group 0813 in total imports to Uzbekistan decreased by 0 p.p. compared to 2022 (it was 0.003% in 2022 and cumulative imports to Uzbekistan were equal to $ 28 billion).
Imports of commodity group 0813 reached 0.579% of total imports of group "" to Uzbekistan in 2023 (imports of commodity group to Uzbekistan totalled $183 million in 2023). The share of purchases of commodity group 0813 in imports of commodity group to Uzbekistan went down by 0.29 p.p. compared to 2022 (it was 0.869% in 2022, and imports of commodity group to Uzbekistan accounted for $124 million).
Where does Uzbekistan import Fruit, dried, other than that of headings Nos. 08.01 to 08.06; mixtures of nuts or dried fruits of this Chapter from?
Top trading partners (import of "Fruit, dried, other than that of headings Nos. 08.01 to 08.06; mixtures of nuts or dried fruits of this Chapter") of Uzbekistan in 2023:
- Afghanistan with a share of 31% (333 thousand US$)
- Tajikistan with a share of 12.3% (131 thousand US$)
- Russia with a share of 11.7% (125 thousand US$)
- Israel with a share of 11.1% (118 thousand US$)
- China with a share of 10.1% (108 thousand US$)
- Belarus with a share of 7.88% (83 thousand US$)
- Kyrgyz Republic with a share of 4.34% (46 thousand US$)
- Turkey with a share of 4.2% (44 thousand US$)
- Iraq with a share of 3.15% (33 thousand US$)
- Lithuania with a share of 2.45% (26 thousand US$)
Imports structure of 0813 - Fruit, dried, other than that of headings Nos. 08.01 to 08.06; mixtures of nuts or dried fruits of this Chapter - to Uzbekistan in 2023 represented by the following main commodity groups:
- 72% (776 thousand US$): 081310 - Apricots, dried
- 21% (228 thousand US$): 081320 - Prunes, dried
- 3.34% (35 thousand US$): 081340 - Dried fruit (excl. of 0812)
- 2.41% (25 thousand US$): 081350 - Mixtures of nuts or dried fruits of Ch.8
- 0.005% (60 US$): 081330 - Apples, dried