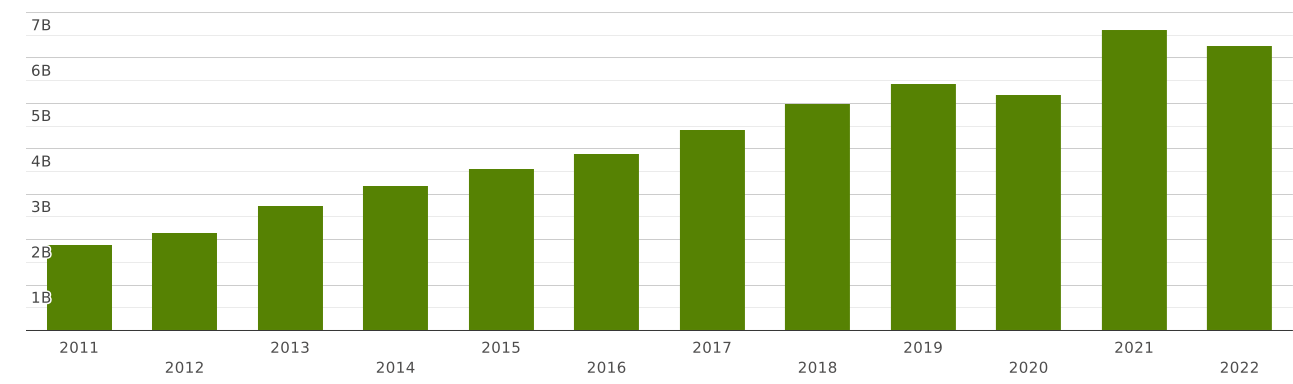
Vietnam | Imports and Exports | World | Knitted or crocheted fabrics | Value (US$) and Value Growth, YoY (%) | 2011 - 2022
The value of exports of commodity group 60 "Knitted or crocheted fabrics" from Vietnam totalled $ 1.46 billion in 2022. Sales of commodity group 60 from Vietnam went up by 1.01% compared to 2021: exports of commodity group 60 "Knitted or crocheted fabrics" went up by $ 14.7 million (cumulative exports of commodity group 60 from Vietnam amounted $1.45 billion in 2021)
Exports of commodity group 60 "Knitted or crocheted fabrics" amounted to 0.395% of total exports from Vietnam (cumulative merchandise exports from Vietnam totalled $ 370 billion in 2022). The share of commodity group 60 in total exports from Vietnam decreased by 0.036 p.p. compared to 2021 (it was 0.432% in 2021 and cumulative exports from Vietnam were equal to $ 335 billion).
Where does Vietnam export Knitted or crocheted fabrics?
Top export destinations of "Knitted or crocheted fabrics" from Vietnam in 2022:
- Cambodia with a share of 50% (742 million US$)
- Indonesia with a share of 14.8% (217 million US$)
- China with a share of 8.5% (124 million US$)
- Thailand with a share of 6.24% (91 million US$)
- India with a share of 2.6% (38 million US$)
- Bangladesh with a share of 2.56% (37 million US$)
- Myanmar with a share of 1.97% (29 million US$)
- Philippines with a share of 1.94% (28 million US$)
- Korea with a share of 1.75% (25 million US$)
- Sri Lanka with a share of 1.26% (18.5 million US$)
Exports structure of 60 - Knitted or crocheted fabrics - from Vietnam in 2022 represented by the following main commodity groups:
- 58% (860 million US$): 6006 - Other knitted or crocheted fabrics
- 19.1% (281 million US$): 6004 - Knitted or crocheted fabrics of a width exceeding 30 cm, containing by weight 5 % or more of elastomeric yarn or rubber thread, other than those of heading 60.01
- 17.9% (263 million US$): 6001 - Pile fabrics, including long pile fabrics and terry fabrics, knitted or crocheted
- 3.87% (56 million US$): 6005 - Warp knit fabrics (including those made on galloon knitting machines), other than those of headings 60.01 to 60.04.
- 0.23% (3.38 million US$): 6002 - Knitted or crocheted fabrics of a width not exceeding 30 cm, containing by weight 5 % or more of elastomeric yarn or rubber thread, other than those of heading 60.01
- 0.067% (991 thousand US$): 6003 - Knitted or crocheted fabrics of a width not exceeding 30 cm, other than those of heading 60.01 or 60.02.
The value of imports of commodity group 60 "Knitted or crocheted fabrics" to Vietnam totalled $ 6.27 billion in 2022. Sales of commodity group 60 to Vietnam decreased by 5.35% in value terms compared to 2021. imports of commodity group 60 "Knitted or crocheted fabrics" decreased by $ 354 million (the value of imports of commodity group 60 to Vietnam was equal to $6.62 billion in 2021)
Imports of commodity group 60 "Knitted or crocheted fabrics" accounted for 1.74% of total import flow to Vietnam (in 2022, total imports to Vietnam amounted to $ 358 billion). The share of commodity group 60 in total imports to Vietnam decreased by 0.255 p.p. compared to 2021 (it was 2% in 2021 and cumulative imports to Vietnam were equal to $ 330 billion).
Where does Vietnam import Knitted or crocheted fabrics from?
Top trading partners (import of "Knitted or crocheted fabrics") of Vietnam in 2022:
- China with a share of 62% (3.95 billion US$)
- Other Asia, nes with a share of 15.7% (985 million US$)
- Korea with a share of 12.4% (779 million US$)
- Thailand with a share of 2.39% (150 million US$)
- Japan with a share of 1.85% (116 million US$)
- Malaysia with a share of 1.24% (78 million US$)
- Indonesia - 52 million US$
- Italy - 41 million US$
- Cambodia - 37 million US$
- Hong Kong - 27 million US$
Imports structure of 60 - Knitted or crocheted fabrics - to Vietnam in 2022 represented by the following main commodity groups:
- 58% (3.69 billion US$): 6006 - Other knitted or crocheted fabrics
- 25% (1.6 billion US$): 6004 - Knitted or crocheted fabrics of a width exceeding 30 cm, containing by weight 5 % or more of elastomeric yarn or rubber thread, other than those of heading 60.01
- 8.83% (554 million US$): 6001 - Pile fabrics, including long pile fabrics and terry fabrics, knitted or crocheted
- 6.11% (383 million US$): 6005 - Warp knit fabrics (including those made on galloon knitting machines), other than those of headings 60.01 to 60.04.
- 0.368% (23 million US$): 6002 - Knitted or crocheted fabrics of a width not exceeding 30 cm, containing by weight 5 % or more of elastomeric yarn or rubber thread, other than those of heading 60.01
- 0.145% (9.1 million US$): 6003 - Knitted or crocheted fabrics of a width not exceeding 30 cm, other than those of heading 60.01 or 60.02.