Export and Import Structure by Country (HS)
Publication date: 2025-01-10
Reporting period: 2017-10 - 2024-06
Timeseries: 40 million
Source:TrendEconomy
Time period
2021-05
Aggregation level
0 Total
Reporter
Pakistan
Trade flow
Import Imports
Partner
World
Commodity
TOTAL Total of all HS commodities
Commodity
0101 Horses, asses, mules and hinnies; live
0102 Bovine animals; live
0103 Swine; live
0104 Sheep and goats; live
0105 Poultry; live, fowls of the species gallus domesticus, ducks, geese, turkeys and guinea fowls
0106 Animals; live, n.e.c. in chapter 01
0201 Meat of bovine animals; fresh or chilled
0202 Meat of bovine animals; frozen
0203 Meat of swine; fresh, chilled or frozen
0204 Meat of sheep or goats; fresh, chilled or frozen
0205 Meat; of horses, asses, mules or hinnies, fresh, chilled or frozen
0206 Edible offal of bovine animals, swine, sheep, goats, horses, asses, mules or hinnies; fresh, chilled or frozen
0207 Meat and edible offal of poultry; of the poultry of heading no. 0105, (ie fowls of the species gallus domesticus), fresh, chilled or frozen
0208 Meat and edible meat offal, n.e.s. in chapter 2; fresh, chilled or frozen
0209 Pig fat, free of lean meat, and poultry fat, not rendered or otherwise extracted, fresh, chilled, frozen, salted, in brine, dried or smoked
0210 Meat and edible meat offal; salted, in brine, dried or smoked; edible flours and meals of meat or meat offal
0301 Fish; live
0302 Fish; fresh or chilled, excluding fish fillets and other fish meat of heading 0304
0303 Fish; frozen, excluding fish fillets and other fish meat of heading 0304
0304 Fish fillets and other fish meat (whether or not minced); fresh, chilled or frozen
0305 Fish; dried, salted or in brine, smoked fish, whether or not cooked before or during the smoking process, fish meal fit for human consumption
0306 Crustaceans; in shell or not, live, fresh, chilled, frozen, dried, salted or in brine; smoked, cooked or not before or during smoking; in shell, steamed or boiled, whether or not chilled, frozen, dried, salted or in brine; edible flours, meals, pellets
0307 Molluscs; whether in shell or not, live, fresh, chilled, frozen, dried, salted or in brine; smoked molluscs, whether in shell or not, cooked or not before or during the smoking process; flours, meals and pellets of molluscs, fit for human consumption
0308 Aquatic invertebrates, other than crustaceans and molluscs; live, fresh, chilled, frozen, dried, salted or in brine, smoked, whether or not cooked before or during the smoking process; flours, meals, and pellets, fit for human consumption
0309 Flours, meals and pellets of fish, crustaceans, molluscs and other aquatic invertebrates, fit for human consumption
0401 Milk and cream; not concentrated, not containing added sugar or other sweetening matter
0402 Milk and cream; concentrated or containing added sugar or other sweetening matter
0403 Buttermilk, curdled milk and cream, yoghurt, kephir, fermented or acidified milk or cream, whether or not concentrated, containing added sugar, sweetening matter, flavoured or added fruit or cocoa
0404 Whey and products consisting of natural milk constituents; whether or not containing added sugar or other sweetening matter, not elsewhere specified or included
0405 Butter and other fats and oils derived from milk; dairy spreads
0406 Cheese and curd
0407 Birds' eggs, in shell; fresh, preserved or cooked
0408 Birds' eggs, not in shell; egg yolks, fresh, dried, cooked by steaming or boiling in water, moulded, frozen or otherwise preserved, whether or not containing added sugar or other sweetening matter
0409 Honey; natural
0410 Edible products of animal origin; not elsewhere specified or included
0501 Human hair; unworked, whether or not washed or scoured; waste of human hair
0502 Pigs', hogs' or boars' bristles and hair; and waste thereof
0503 Horsehair and horsehair waste; whether or not put up as a layer with or without supporting material
0504 Guts, bladders and stomachs of animals (other than fish); whole and pieces thereof, fresh, chilled, frozen, salted, in brine, dried or smoked
0505 Skins and other parts of birds with feathers, down; feathers, down and parts thereof; not further worked than cleaned, disinfected, treated for preservation; powder, waste and parts of feathers
0506 Bones and horn-cores, unworked, defatted, simply prepared (but not cut to shape), treated with acid or degelatinised; powder and waste of these products
0507 Ivory, tortoise-shell, whalebone and whalebone hair, horns, antlers, hooves, nails, claws and beaks unworked or simply prepared, not cut to shape; waste and powder of these products
0508 Coral and similar materials, unworked or simply prepared, shells of molluscs, crustaceans or echinoderms and cuttle-bone, not cut to shape powder and waste thereof
0509 Sponges, natural; of animal origin
0510 Ambergris, castoreum, civet and musk; cantharides; bile, dried or not glands, other animal products used in preparation of pharmaceutical products, fresh chilled, frozen or otherwise provisionally preserved
0511 Animal products not elsewhere specified or included; dead animals of chapter 1 or 3, unfit for human consumption
0601 Bulbs, tubers, tuberous roots, corms, crowns and rhizomes; dormant, in growth or in flower; chicory plants and roots other than roots of heading no. 1212
0602 Plants, live; n.e.s. in heading no. 0601, (including their roots) cuttings and slips; mushroom spawn
0603 Flowers; cut flowers and flower buds of a kind suitable for bouquets or for ornamental purposes, fresh, dried, dyed, bleached, impregnated or otherwise prepared
0604 Foliage, branches and other parts of plants, without flowers or flower buds, and grasses, mosses and lichens; suitable for bouquets or for ornamental purposes, fresh, dried, dyed, bleached, impregnated etc.
0701 Potatoes; fresh or chilled
0702 Tomatoes; fresh or chilled
0703 Onions, shallots, garlic, leeks and other alliaceous vegetables; fresh or chilled
0704 Cabbages, cauliflowers, kohlrabi, kale and similar edible brassicas; fresh or chilled
0705 Lettuce (lactuca sativa) and chicory (cichorium spp.) fresh or chilled
0706 Carrots, turnips, salad beetroot, salsify, celeriac, radishes and similar edible roots; fresh or chilled
0707 Cucumbers and gherkins; fresh or chilled
0708 Leguminous vegetables; shelled or unshelled, fresh or chilled
0709 Vegetables; n.e.c. in chapter 07, fresh or chilled
0710 Vegetables (uncooked or cooked by steaming or boiling in water); frozen
0711 Vegetables provisionally preserved; (egg by sulphur dioxide gas, in brine, in sulphur water or in other preservative solutions), but unsuitable in that state for immediate consumption
0712 Vegetables, dried; whole, cut, sliced, broken or in powder, but not further prepared
0713 Vegetables, leguminous; shelled, whether or not skinned or split, dried
0714 Manioc, arrowroot, salep, Jerusalem artichokes, sweet potatoes and similar roots and tubers with high starch or inulin content; fresh, chilled, frozen or dried, whether or not sliced or in the form of pellets; sago pith
0801 Nuts, edible; coconuts, Brazil nuts and cashew nuts, fresh or dried, whether or not shelled or peeled
0802 Nuts (excluding coconuts, Brazils and cashew nuts); fresh or dried, whether or not shelled or peeled
0803 Bananas, including plantains; fresh or dried
0804 Dates, figs, pineapples, avocados, guavas, mangoes and mangosteens; fresh or dried
0805 Citrus fruit; fresh or dried
0806 Grapes; fresh or dried
0807 Melons (including watermelons) and papaws (papayas); fresh
0808 Apples, pears and quinces; fresh
0809 Apricots, cherries, peaches (including nectarines), plums and sloes, fresh
0810 Fruit, fresh; n.e.s. in chapter 8
0811 Fruit and nuts; uncooked or cooked by steaming or boiling in water, frozen, whether or not containing added sugar or other sweetening matter
0812 Fruit and nuts provisionally preserved; e.g. by sulphur dioxide gas, brine, in sulphur water or in other preservative solutions, but unsuitable in that state for immediate consumption
0813 Fruit, dried, other than that of heading no. 0801 to 0806; mixtures of nuts or dried fruits of this chapter
0814 Peel of citrus fruit or melons (including watermelons); fresh, frozen dried or provisionally preserved in brine, in sulphur water or in other preservative solutions
0901 Coffee, whether or not roasted or decaffeinated; husks and skins; coffee substitutes containing coffee in any proportion
0902 Tea
0903 Mate
0904 Pepper of the genus piper; dried or crushed or ground fruits of the genus capsicum or of the genus pimenta
0905 Vanilla
0906 Cinnamon and cinnamon-tree flowers
0907 Cloves; (whole fruit, cloves and stems)
0908 Nutmeg, mace and cardamoms
0909 Seeds of anise, badian, fennel, coriander, cumin, caraway or juniper
0910 Ginger, saffron, tumeric (curcuma), thyme, bay leaves, curry and other spices
1001 Wheat and meslin
1002 Rye
1003 Barley
1004 Oats
1005 Maize (corn)
1006 Rice
1007 Grain sorghum
1008 Buckwheat, millet and canary seeds; other cereals
1101 Wheat or meslin flour
1102 Cereal flours; other than of wheat or meslin
1103 Cereal groats; meal and pellets
1104 Cereal grains otherwise worked (egg hulled, rolled, flaked, pearled, sliced or kibbled) except rice of heading no. 1006; germ of cereals whole, rolled, flaked or ground
1105 Flour, meal, powder, flakes, granules and pellets of potatoes
1106 Flour, meal and powder; of the dried leguminous vegetables of heading no. 0713, of sago or of roots or tubers of heading no. 0714 or of the products of chapter 8
1107 Malt; whether or not roasted
1108 Starches; inulin
1109 Wheat gluten; whether or not dried
1201 Soya beans; whether or not broken
1202 Ground-nuts; not roasted or otherwise cooked, whether or not shelled or broken
1203 Copra
1204 Oil seeds; linseed, whether or not broken
1205 Rape or colza seeds; whether or not broken
1206 Sunflower seeds; whether or not broken
1207 Oil seeds and oleaginous fruits, others n.e.s. in chapter 12; whether or not broken
1208 Flours and meals of oil seeds or oleaginous fruits; other than those of mustard
1209 Seeds, fruit and spores; of a kind used for sowing
1210 Hop cones, fresh or dried, whether or not ground, powdered or in the form of pellets; lupulin
1211 Plants and parts of plants (including seeds and fruits), used primarily in perfumery, pharmacy; for insecticidal, fungicidal or similar purposes, fresh or dried, whether or not crushed or powdered
1212 Locust beans, seaweeds and other algae, sugar beet, sugar cane; fresh, dried, whether or not ground; fruit stones, kernels and other vegetable products (including unroasted chicory roots) used primarily for human consumption, n.e.s.
1213 Cereal straw and husks, unprepared; whether or not chopped, ground, pressed or in the form of pellets
1214 Swedes, mangolds, fodder roots, hay, lucerne (alfalfa), clover, sainfoin, forage kale, lupines, vetches and similar forage products, whether or not in the form of pellets
1301 Lac; natural gums, resins, gum-resins and oleoresins (for example, balsams)
1302 Vegetable saps and extracts; pectic substances, pectinates and pectates; agar-agar and other mucilages and thickeners, whether or not modified, derived from vegetable products
1401 Vegetable materials of a kind used primarily for plaiting; (egg bamboos, rattans, reeds, rushes, osier, raffia, cleaned, bleached or dyed cereal straw and lime bark)
1402 Vegetable materials of a kind used primarily as stuffing or as padding; (eg kapok, vegetable hair and eel grass), whether or not put up as a layer with or without supporting material
1403 Vegetable materials of a kind used primarily in brooms or brushes; (eg broomcorn, piassava, couch-grass and istle), whether or not in hanks or bundles
1404 Vegetable products not elsewhere specified or included
1501 Pig fat (including lard) and poultry fat, other than that of heading no. 0209 or 1503
1502 Fats of bovine animals, sheep or goats; raw or rendered, whether or not pressed or solvent-extracted
1503 Lard stearin, lard oil, oleostearin, oleo-oil and tallow oil; not emulsified or mixed or otherwise prepared
1504 Fats and oils and their fractions of fish or marine mammals; whether or not refined, but not chemically modified
1505 Wool grease and fatty substances derived therefrom (including lanolin)
1506 Animal fats and oils and their fractions; whether or not refined, but not chemically modified, n.e.s. in chapter 15
1507 Soya-bean oil and its fractions; whether or not refined, but not chemically modified
1508 Ground nut oil and its fractions; whether or not refined, but not chemically modified
1509 Olive oil and its fractions; whether or not refined, but not chemically modified
1510 Oils and their fractions n.e.s. in chapter 15, obtained solely from olives, whether or not refined, but not chemically modified, including blends of these oils or fractions with oils or fractions of heading no. 1509
1511 Palm oil and its fractions; whether or not refined, but not chemically modified
1512 Sun-flower seed, safflower or cotton-seed oil and their fractions; whether or not refined, but not chemically modified
1513 Coconut (copra), palm kernel or babassu oil and their fractions; whether or not refined but not chemically modified
1514 Rape, colza or mustard oil and their fractions; whether or not refined, but not chemically modified
1515 Fixed vegetable fats and oils (including jojoba oil) and their fractions, whether or not refined; but not chemically modified
1516 Animal or vegetable fats and oils and their fractions; partly or wholly hydrogenated, inter-esterified, re-esterified or elaidinised, whether or not refined, but not further prepared
1517 Margarine; edible mixtures or preparations of animal or vegetable fats or oils or of fractions of different fats or oils of this chapter, other than edible fats or oils of heading no. 1516
1518 Animal or vegetable fats, oils, fractions, modified in any way, excluding heading no. 1516; inedible versions of animal or vegetable fats, oils or fractions of this chapter, n.e.s. or included
1519 Industrial monocarboxylic fatty acids; acid oils from refining; industrial fatty alcohols, *** NOTE*** data from this heading moved to new heading no. 3823 from 1 January 1996
1520 Glycerol, crude; glycerol waters and glycerol lyes
1521 Vegetable waxes (other than triglycerides), beeswax, other insect waxes and spermaceti; whether or not refined or coloured
1522 Degras; residues resulting from the treatment of fatty substances or animal or vegetable waxes
1601 Sausages and similar products of meat, meat offal or blood; food preparations based on these products
1602 Prepared or preserved meat, meat offal or blood
1603 Extracts and juices of meat, fish or crustaceans, molluscs or other aquatic invertebrates
1604 Prepared or preserved fish; caviar and caviar substitutes prepared from fish eggs
1605 Crustaceans, molluscs and other aquatic invertebrates, prepared or preserved
1701 Cane or beet sugar and chemically pure sucrose, in solid form
1702 Sugars, including lactose, maltose, glucose or fructose in solid form; sugar syrups without added flavouring or colouring matter; artificial honey, whether or not mixed with natural honey; caramel
1703 Molasses; resulting from the extraction or refining of sugar
1704 Sugar confectionery (including white chocolate), not containing cocoa
1801 Cocoa beans; whole or broken, raw or roasted
1802 Cocoa; shells, husks, skins and other cocoa waste
1803 Cocoa; paste; whether or not defatted
1804 Cocoa; butter, fat and oil
1805 Cocoa; powder, not containing added sugar or other sweetening matter
1806 Chocolate and other food preparations containing cocoa
1901 Malt extract; flour/groats/meal/starch/malt extract products, no cocoa (or less than 40% by weight) and food preparations of goods of headings 04.01 to 04.04, no cocoa (or less than 5% by weight), weights calculated on a totally defatted basis, n.e.c.
1902 Pasta; whether or not cooked or stuffed with meat or other substance, or otherwise prepared, egg spaghetti, macaroni, noodles, lasagne, gnocchi, ravioli, cannelloni; couscous, whether or not prepared
1903 Tapioca and substitutes therefor prepared from starch; in the form of flakes, grains, pearls, siftings or similar forms
1904 Prepared foods obtained by swelling, roasting of cereals or cereal products (eg corn flakes); cereals, other than maize (corn), in grain form, pre-cooked or otherwise prepared
1905 Bread, pastry, cakes, biscuits, other bakers' wares, whether or not containing cocoa; communion wafers, empty cachets suitable for pharmaceutical use, sealing wafers, rice paper and similar products
2001 Vegetables, fruit, nuts and other edible parts of plants; prepared or preserved by vinegar or acetic acid
2002 Tomatoes; prepared or preserved otherwise than by vinegar or acetic acid
2003 Mushrooms and truffles, prepared or preserved other than by vinegar or acetic acid
2004 Vegetables preparations n.e.s.; prepared or preserved otherwise than by vinegar or acetic acid, frozen, other than products of heading no. 2006
2005 Vegetables preparations n.e.s.; prepared or preserved otherwise than by vinegar or acetic acid, not frozen, other than products of heading no. 2006
2006 Vegetables, fruit, nuts, fruit-peel and other parts of plants, preserved by sugar (drained, glace or crystallised)
2007 Jams, fruit jellies, marmalades, fruit or nut puree and fruit or nut pastes, being cooked preparations; whether or not containing added sugar or other sweetening matter
2008 Fruit, nuts and other edible parts of plants; prepared or preserved in ways n.e.s., whether or not containing added sugar or other sweetening matter or spirit, not elsewhere specified or included
2009 Fruit juices (including grape must) and vegetable juices, unfermented, not containing added spirit; whether or not containing added sugar or other sweetening matter
2101 Extracts, essences, concentrates of coffee, tea or mate; preparations with a basis of these products or with a basis of coffee, tea or mate; roasted chicory and other roasted coffee substitutes and extracts, essences and concentrates thereof
2102 Yeasts (active or inactive); other single-cell micro-organisms, dead (but not including vaccines of heading no. 3002); prepared baking powders
2103 Sauces and preparations therefor; mixed condiments and mixed seasonings, mustard flour and meal and prepared mustard
2104 Soups and broths and preparations therefor; homogenised composite food preparations
2105 Ice cream and other edible ice; whether or not containing cocoa
2106 Food preparations not elsewhere specified or included
2201 Waters, including natural or artificial mineral waters and aerated waters, not containing added sugar or other sweetening matter nor flavoured; ice and snow
2202 Waters, including mineral and aerated waters, containing added sugar or sweetening matter, flavoured; other non-alcoholic beverages, not including fruit or vegetable juices of heading no. 2009
2203 Beer made from malt
2204 Wine of fresh grapes, including fortified wines; grape must other than that of heading no. 2009
2205 Vermouth and other wine of fresh grapes, flavoured with plants or aromatic substances
2206 Fermented beverages, n.e.s. in chapter 22; (eg cider, perry, mead)
2207 Ethyl alcohol, undenatured; of an alcoholic strength by volume of 80% vol. or higher; ethyl alcohol and other spirits, denatured, of any strength
2208 Ethyl alcohol, undenatured; of an alcoholic strength by volume of less than 80% volume; spirits, liqueurs, other beverages; compound alcoholic preparations of a kind used for the manufacture of beverages
2209 Vinegar and substitutes for vinegar obtained from acetic acid
2301 Flours, meal and pellets, of meat or meat offal, of fish or of crustaceans, molluscs or other aquatic invertebrates, unfit for human consumption; greaves
2302 Bran, sharps and other residues; whether or not in the form of pellets derived from the sifting, milling or other working of cereals or of leguminous plants
2303 Residues of starch manufacture, similar residues; beet-pulp, bagasse and other waste of sugar manufacture, brewing or distilling dregs and waste, whether or not in the form of pellets
2304 Oil-cake and other solid residues; whether or not ground or in the form of pellets, resulting from the extraction of soya-bean oil
2305 Oil-cake and other solid residues; whether or not ground or in the form of pellets, resulting from the extraction of ground-nut oil
2306 Oil-cake and other solid residues; whether or not ground or in the form of pellets, resulting from the extraction of vegetable fats or oils other than those of heading no. 2304 or 2305
2307 Wine lees; argol
2308 Vegetable materials and vegetable waste, vegetable residues and bi-products; whether or not in the form of pellets, of a kind used in animal feeding, not elsewhere specified or included
2309 Preparations of a kind used in animal feeding
2401 Tobacco, unmanufactured; tobacco refuse
2402 Cigars, cheroots, cigarillos and cigarettes; of tobacco or of tobacco substitutes
2403 Manufactured tobacco and manufactured tobacco substitutes; n.e.s., homogenised or reconstituted tobacco; tobacco extracts, essences
2404 Products containing tobacco, reconstituted tobacco, nicotine, or tobacco or nicotine substitutes, intended for inhalation without combustion; other nicotine containing products intended for the intake of nicotine into the human body
2501 Salt (including table salt and denatured salt); pure sodium chloride whether or not in aqueous solution; sea water
2502 Iron pyrites; unroasted
2503 Sulphur of all kinds; other than sublimed, precipitated and colloidal sulphur
2504 Graphite; natural
2505 Sands of all kinds; natural, whether or not coloured, other than metal-bearing sands of chapter 26
2506 Quartz; (other than natural sands), quartzite, whether or not roughly trimmed or merely cut, by sawing or otherwise, into blocks or slabs of a rectangular (including square) shape
2507 Kaolin and other kaolinic clays; whether or not calcined
2508 Clays; (not including expanded clays of heading no. 6806), andalusite kyanite and sillimanite, whether or not calcined; mullite; chamotte or dinas earth
2509 Chalk
2510 Natural calcium phosphates; natural aluminium calcium phosphates and phosphatic chalk
2511 Natural barium sulphate (barytes); natural barium carbonate, (witherite) whether or not calcined, other than barium oxide of heading no. 2816
2512 Siliceous fossil meals (egg kieselguhr, tripolite and diatomite) and similar siliceous earths; whether or not calcined, of an apparent specific gravity of 1 or less
2513 Pumice stone; emery; natural corundum, natural garnet and other natural abrasives, whether or not heat treated
2514 Slate, whether or not roughly trimmed or merely cut, by sawing or otherwise, into blocks or slabs of a rectangular (including square) shape
2515 Marble, travertine, ecaussine and other calcareous stone; of an apparent specific gravity of less than 2.5, alabaster, whether cut by sawing etc, into blocks, slabs of a rectangular (square) shape
2516 Granite, porphyry, basalt, sandstone, other monumental and building stone, whether or not roughly trimmed, cut, by sawing etc, into blocks or slabs of a rectangular (including square) shape
2517 Pebbles, gravel, crushed stone for concrete aggregates for road or railway ballast, shingle or flint; macadam of slag, dross etc tarred granules, chippings, powder of stones of heading no. 2515 and 2516
2518 Dolomite, whether or not calcined; dolomite roughly trimmed, cut by sawing or otherwise into blocks or slabs of rectangular (including square) shape; agglomerated dolomite (including tarred dolomite)
2519 Natural magnesium carbonate (magnesite); fused magnesia; dead-burned (sintered) magnesia, whether or not containing small quantities of other oxides added before sintering; magnesium oxide, pure or not
2520 Gypsum; anhydrite; plasters (consisting of calcined gypsum or calcium sulphate), coloured or not, with or without small quantities of accelerators or retarders
2521 Limestone flux; limestone and other calcareous stone, of a kind used for the manufacture of lime or cement
2522 Quicklime, slaked lime and hydraulic lime; other than calcium oxide and hydroxide of heading no. 2825
2523 Portland cement, aluminous cement (ciment fondu), slag cement, supersulphate cement and similar hydraulic cements, whether or not coloured or in the form of clinkers
2524 Asbestos
2525 Mica, including splittings; mica waste
2526 Natural steatite; whether or not roughly trimmed or merely cut, by sawing or otherwise, into blocks or slabs of a rectangular (including square) shape; talc
2527 Natural cryolite; natural chiolite
2528 Natural borates and concentrates thereof (whether or not calcined), but not including borates separated from natural brine; natural boric acid containing not more than 85 % of H3BO3 calculated on the dry weight
2529 Felspar; leucite; nepheline and nepheline syenite; fluorspar
2530 Mineral substances not elsewhere specified or included
2601 Iron ores and concentrates; including roasted iron pyrites
2602 Manganese ores and concentrates, including manganiferous iron ores and concentrates with a manganese content of 20% or more, calculated on the dry weight
2603 Copper ores and concentrates
2604 Nickel ores and concentrates
2605 Cobalt ores and concentrates
2606 Aluminium ores and concentrates
2607 Lead ores and concentrates
2608 Zinc ores and concentrates
2609 Tin ores and concentrates
2610 Chromium ores and concentrates
2611 Tungsten ores and concentrates
2612 Uranium or thorium ores and concentrates
2613 Molybdenum ores and concentrates
2614 Titanium ores and concentrates
2615 Niobium, tantalum, vanadium or zirconium ores and concentrates
2616 Precious metal ores and concentrates
2617 Ores and concentrates; n.e.s. in heading no. 2601
2618 Granulated slag (slag sand) from the manufacture of iron or steel
2619 Slag, dross; (other than granulated slag), scalings and other waste from the manufacture of iron or steel
2620 Slag, ash and residues; (not from the manufacture of iron or steel) containing metals, arsenic or their compounds
2621 Slag and ash, including seaweed ash (kelp), n.e.s. in chapter 26
2701 Coal; briquettes, ovoids and similar solid fuels manufactured from coal
2702 Lignite; whether or not agglomerated, excluding jet
2703 Peat; (including peat litter), whether or not agglomerated
2704 Coke and semi-coke; of coal, lignite or peat, whether or not agglomerated; retort carbon
2705 Coal gas, water gas, producer gas and similar gases, other than petroleum gases and other gaseous hydrocarbons
2706 Tar distilled from coal, from lignite, peat and other mineral tars, whether or not dehydrated or partially distilled; including reconstituted tars
2707 Oils and other products of the distillation of high temperature coal tar; similar products in which the weight of the aromatic constituents exceeds that of the non-aromatic constituents
2708 Pitch and pitch coke; obtained from coal tar or from other mineral tars
2709 Petroleum oils and oils obtained from bituminous minerals; crude
2710 Petroleum oils, oils from bituminous minerals, not crude; preparations n.e.s. containing less than 70% petroleum oils, oils from bituminous minerals; these being the basic constituents of the preparations
2711 Petroleum gases and other gaseous hydrocarbons
2712 Petroleum jelly; paraffin wax, micro-crystalline petroleum wax, slack wax, ozokerite, lignite wax, peat wax, other mineral waxes, similar products obtained by synthesis, other processes; coloured or not
2713 Petroleum coke, petroleum bitumen; other residues of petroleum oils or oils obtained from bituminous minerals
2714 Bitumen and asphalt, natural; bituminous or oil shale and tar sands; asphaltites and asphaltic rocks
2715 Bituminous mixtures based on natural asphalt; on natural bitumen, on petroleum bitumen, on mineral tar or on mineral tar pitch (egg bituminous mastics, cut-backs)
2716 Electrical energy
2801 Fluorine, chlorine, bromine and iodine
2802 Sulphur; sublimed or precipitated, colloidal sulphur
2803 Carbon; carbon blacks and other forms of carbon n.e.s.
2804 Hydrogen, rare gases and other non-metals
2805 Alkali or alkaline-earth metals; rare-earth metals, scandium and yttrium, whether or not intermixed or interalloyed; mercury
2806 Hydrogen chloride (hydrochloric acid); chlorosulphuric acid
2807 Sulphuric acid; oleum
2808 Nitric acid; sulphonitric acids
2809 Diphosphorus pentoxide; phosphoric acid and polyphosphoric acids
2810 Oxides of boron; boric acids
2811 Inorganic acids and other inorganic oxygen compounds of non-metals; n.e.s. in heading no. 2806 to 2810
2812 Halides and halide oxides of non-metals
2813 Sulphides of non-metals; commercial phosphorus trisulphide
2814 Ammonia; anhydrous or in aqueous solution
2815 Sodium hydroxide (caustic soda); potassium hydroxide (caustic potash) peroxides of sodium or potassium
2816 Hydroxide and peroxide of magnesium; oxides, hydroxides and peroxides of strontium or barium
2817 Zinc; oxide and peroxide
2818 Aluminium oxide (including artificial corundum); aluminium hydroxide
2819 Chromium oxides and hydroxides
2820 Manganese oxides
2821 Iron oxides and hydroxides; earth colours containing 70% or more by weight of combined iron evaluated as Fe2o3
2822 Cobalt oxides and hydroxides; commercial cobalt oxides
2823 Titanium oxides
2824 Lead oxides; red lead and orange lead
2825 Hydrazine and hydroxylamine and their inorganic salts; other inorganic bases; other metal oxides, hydroxides and peroxides
2826 Fluorides; fluorosilicates, fluoroaluminates and other complex fluorine salts
2827 Chlorides; chloride oxides and chloride hydroxides; bromides and bromide oxides; iodides and iodide oxides
2828 Hypochlorites; commercial calcium hypochlorite; chlorites; hypobromites
2829 Chlorates and perchlorates; bromates and perbromates; iodates and periodates
2830 Sulphides; polysulphides whether or not chemically defined
2831 Dithionites and sulphoxylates
2832 Sulphites; thiosulphates
2833 Sulphates; alums; peroxosulphates (persulphates)
2834 Nitrites; nitrates
2835 Phosphinates (hypophosphites), phosphonates (phosphites), phosphates and polyphosphates
2836 Carbonates; peroxocarbonates (percarbonates); commercial ammonium carbonate containing ammonium carbamate
2837 Cyanides, cyanide oxides and complex cyanides
2838 Fulminates, cyanates and thiocyanates
2839 Silicates; commercial alkali metal silicates
2840 Borates; peroxoborates (perborates)
2841 Salts of oxometallic or peroxometallic acids
2842 Salts of inorganic acids or peroxoacids, n.e.c. including aluminosilicates whether or not chemically defined, but excluding azides
2843 Colloidal precious metals; inorganic or organic compounds of precious metals, whether or not chemically defined; amalgams of precious metals
2844 Radioactive chemical elements and radioactive isotopes (including the fissile or fertile chemical elements and isotopes); and their compounds; mixtures and residues containing these products
2845 Isotopes other than those of heading no. 2844; compounds, inorganic or organic, of such isotopes, whether or not chemically defined
2846 Compounds, inorganic or organic, of rare-earth metals; of yttrium or of scandium or of mixtures of these metals
2847 Hydrogen peroxide; whether or not solidified with urea
2848 Phosphides; whether or not chemically defined, excluding ferrophosphorus
2849 Carbides, whether or not chemically defined
2850 Hydrides, nitrides, azides, silicides and borides, whether or not chemically defined, other than compounds which are also carbides of heading no. 2849
2851 Inorganic compounds n.e.s. (including distilled or conductivity water and water of similar purity); liquid air (whether or not rare gases have been removed); compressed air; amalgams, other than precious metal amalgams
2852 Inorganic or organic compounds of mercury, excluding amalgams, whether or not chemically defined
2853 Phosphides, chemically defined or not, not ferrophosphorus; other inorganic compounds n.e.c. (including distilled, conductivity water and water of like purity); liquid air, rare gases removed or not; compressed air; amalgams, not precious metal amalgams
2901 Acyclic hydrocarbons
2902 Cyclic hydrocarbons
2903 Halogenated derivatives of hydrocarbons
2904 Sulphonated, nitrated or nitrosated derivatives of hydrocarbons; whether or not halogenated
2905 Acyclic alcohols and their halogenated, sulphonated, nitrated or nitrosated derivatives
2906 Alcohols; cyclic, and their halogenated, sulphonated, nitrated or nitrosated derivatives
2907 Phenols; phenol-alcohols
2908 Phenols or phenol-alcohols; halogenated, sulphonated, nitrated or nitrosated derivatives thereof
2909 Ethers, ether-alcohols, ether-phenols, ether-alcohol-phenols, alcohol peroxides, ether peroxides, ketone peroxides (chemically defined or not); halogenated, sulphonated, nitrated, nitrosated derivative
2910 Epoxides, epoxyalcohols, epoxyphenols and epoxyethers; with a three-membered ring and their halogenated, sulphonated, nitrated or nitrosated derivatives
2911 Acetals and hemiacetals; whether or not with other oxygen function, and their halogenated, sulphonated, nitrated or nitrostated derivatives
2912 Aldehydes, whether or not with other oxygen function; cyclic polymers of aldehydes; paraformaldehyde
2913 Aldehydes; halogenated, sulphonated, nitrated or nitrosated derivatives of products of heading no. 2912
2914 Ketones and quinones; whether or not with other oxygen function, and their halogenated, sulphonated, nitrated or nitrostated derivatives
2915 Acids; saturated acyclic monocarboxylic acids and their anhydrides, halides, peroxides and peroxyacids; their halogenated, sulphonated, nitrated or nitrosated derivatives
2916 Acids; unsaturated acyclic monocarboxylic, cyclic monocarboxylic, their anhydrides, halides, peroxides and peroxyacids; their halogenated, sulphonated, nitrated or nitrosated derivatives
2917 Acids; polycarboxylic acids, their anhydrides, halides, peroxides and peroxy-acids; their halogenated, sulphonated, nitrated or nitrosated derivatives
2918 Acids; carboxylic acid with additional oxygen function and their anhydrides, halides, peroxides, peroxyacids; their halogenated, sulphonated, nitrated or nitrosated derivatives
2919 Esters; phosphoric, and their salts, including lactophosphates, their halogenated, sulphonated, nitrated or nitrosated derivatives
2920 Esters of other inorganic acids of non-metals (other than of hydrogen halides) and their salts, their halogenated, sulphonated, nitrated or nitrosated derivatives
2921 Amine-function compounds
2922 Oxygen-function amino-compounds
2923 Quaternary ammonium salts and hydroxides; lecithins and other phosphoaminolipids, whether or not chemically defined
2924 Carboxyamide-function compounds; amide-function compounds of carbonic acid
2925 Carboxyimide-function compounds (including saccharin and its salts) and imine-function compounds
2926 Nitrile-function compounds
2927 Diazo-, azo- or azoxy-compounds
2928 Organic derivatives of hydrazine or of hydroxylamine
2929 Nitrogen-function compounds, n.e.s. in chapter 29
2930 Organo-sulphur compounds
2931 Other organo-inorganic compounds
2932 Heterocyclic compounds with oxygen hetero-atom(s) only
2933 Heterocyclic compounds with nitrogen hetero-atom(s) only; nucleic acids and their salts
2934 Nucleic acids and their salts; other heterocyclic compounds
2935 Sulphonamides
2936 Provitamins, vitamins; natural or reproduced by synthesis (including natural concentrates) derivatives thereof used as vitamins, and intermixtures of the fore-going, whether or not in any solvent
2937 Hormones, prostaglandins, thromboxanes and leukotrienes, natural or reproduced by synthesis; derivatives and structural analogues therof, including chain modified polypeptides, used primarily as hormones.
2938 Glycosides, natural or reproduced by synthesis, and their salts, ethers, esters and other derivatives
2939 Alkaloids; natural or reproduced by synthesis, and their salts, ethers, esters and other derivatives
2940 Sugars, chemically pure, other than sucrose, lactose, maltose, glucose or fructose; sugar ethers and sugar esters and their salts, other than products of heading no. 2937, 2938 or 2939
2941 Antibiotics
2942 Organic compounds; n.e.s. in chapter 29
3001 Glands, organs (extracts, secretions thereof) for organo-therapeutic uses, dried, powdered or not; heparin and its salts; other human or animal substances for therapeutic or prophylactic uses n.e.s
3002 Human blood; animal blood for therapeutic, prophylactic or diagnostic uses; antisera, other blood fractions, immunological products, modified or obtained by biotechnological processes; vaccines, toxins, cultures of micro-organisms (excluding yeasts) etc
3003 Medicaments; (not goods of heading no. 3002, 3005 or 3006) of two or more constituents mixed together for therapeutic or prophylactic use not in measured doses or in forms or packings for retail sale
3004 Medicaments; (not goods of heading no. 3002, 3005 or 3006) consisting of mixed or unmixed products for therapeutic or prophylactic use, put up in measured doses or in forms or packings for retail sale
3005 Wadding, gauze, bandages (dressings, adhesive plasters, poultices), impregnated or coated with pharmaceutical substances or in forms or packings for retail sale, for medical, surgical or veterinary use
3006 Pharmaceutical goods
3101 Fertilizers; animal or vegetable, whether or not mixed together or chemically treated; fertilizers produced by the mixing or chemical treatment of animal or vegetable products
3102 Fertilizers; mineral or chemical, nitrogenous
3103 Fertilizers; mineral or chemical, phosphatic
3104 Fertilizers; mineral or chemical, potassic
3105 Fertilizers; mineral or chemical, containing 2 or 3 of the elements nitrogen, phosphorus, potassium; other fertilisers; goods of chapter 31 in tablets or packages of gross weight not exceeding 10kg
3201 Tanning extracts of vegetable origin; tannins and their salts, ethers, esters and other derivatives
3202 Tanning substances; synthetic organic or inorganic tanning substances; tanning preparations, whether or not containing natural tanning substances, enzymatic preparations for pre-tanning
3203 Colouring matter of vegetable or animal origin (including dyeing extracts, not animal black); whether or not chemically defined; preparations based on colouring matter of vegetable or animal origin
3204 Synthetic organic colouring matter and preparations based thereon; synthetic organic products used as fluorescent brightening agents or as luminophores; whether or not chemically defined
3205 Colour lakes; preparations based on colour lakes as specified in note 3 to this chapter
3206 Colouring matter and preparations thereof n.e.s. in heading no. 3203, 3204, 3205; inorganic products, kind used as luminophores whether or not chemically defined
3207 Pigments, prepared; opacifiers, colours, vitrifiable enamels, glazes, engobes (slips), liquid lustres etc as used in the ceramic enamelling or glass industry; glass frit and powder, granules or flakes
3208 Paints, varnishes; (enamels and lacquers) based on synthetic polymers or chemically modified natural polymers, dispersed or dissolved in a non-aqueous medium
3209 Paints and varnishes (including enamels and lacquers) based on synthetic or chemically modified natural polymers, dispersed or dissolved in an aqueous medium
3210 Paints and varnishes (including enamels, lacquers and distempers), excluding those of heading no. 3209, prepared water pigments of a kind used for finishing leather
3211 Driers; prepared
3212 Pigments (metallic powders and flakes) dispersed in non-aqueous media in liquid or paste form, as used in manufacture of paints (including enamels); stamping foils, dyes etc in forms, packing for retail sale
3213 Colours; artists, students, or signboard painters, modifying tints, amusement colours and the like; in tablets, tubes, jars, bottles, pan or in similar forms or packings
3214 Glaziers' putty, grafting putty, resin cements, caulking compounds and other mastics; painters' fillings; non-refractory surfacing preparations for facades, indoor walls, floors, ceilings or the like
3215 Ink; printing, writing or drawing ink and other inks; whether or not concentrated or solid
3301 Oils; essential (concretes, absolutes); concentrates thereof in fats, fixed oils, waxes or the like (obtained by enfleurage or maceration); aqueous distillates, solutions and terpenic by-products thereof; resinoids; extracted oleoresins
3302 Odoriferous substances and mixtures (including alcoholic solutions) with a basis of one or more of these substances, of a kind used as raw materials in industry; other preparations based on odoriferous substances, of a kind used for beverage manufacture
3303 Perfumes and toilet waters
3304 Cosmetic and toilet preparations; beauty, make-up and skin care preparations (excluding medicaments, including sunscreen or sun tan preparations), manicure or pedicure preparations
3305 Hair preparations; for use on the hair
3306 Oral or dental hygiene preparations; including fixative pastes and powders; yarn used to clean between the teeth (dental floss), in individual retail packages
3307 Perfumery, cosmetic or toilet preparations; pre-shave, shaving, after-shave, bath preparations; personal deodorants and depilatories; room deodorisers, perfumed or not with disinfectant properties or not
3401 Soap; organic surface-active products and preparations for use as soap, in the form of bars, cakes, moulded pieces or shapes, containing soap or not; paper, wadding, felt and nonwovens, impregnated, coated or covered with soap or detergent
3402 Organic surface-active agents (not soap); surface-active, washing (including auxiliary washing) and cleaning preparations, containing soap or not, excluding those of heading no. 3401
3403 Lubricating preparations and those used in oil or grease treatment of textile and similar materials; excluding preparations containing 70% or more (by weight) of petroleum or bituminous mineral oils
3404 Waxes; artificial, prepared
3405 Polishes, creams, scouring pastes, powders and similar; in any form, (including articles impregnated, coated or covered with such), for furniture, footwear, floors, coachwork, glass or metal
3406 Candles, tapers and the like
3407 Modelling pastes, including those for children; dental wax, impression compounds, in sets or packings for retail sale or in plates and similar forms; dentistry preparations with plaster base
3501 Casein, caseinates and other casein derivatives; casein glues
3502 Albumins; albuminates and other albumin derivatives
3503 Gelatin (including gelatin in rectangular sheets, whether or not surface-worked or coloured) and gelatin derivatives; isinglass; other glues of animal origin, excluding casein glues of heading no. 3501
3504 Peptones and their derivatives; other protein substances and their derivatives n.e.s. or included; hide powder, whether or not chromed
3505 Dextrins and other modified starches (eg pregelatinised or esterified starches); glues based on starches or on dextrins or other modified starches
3506 Prepared glues and other prepared adhesives, n.e.s. or included; products suitable for use as glues or adhesives, put up for retail sale as glues or adhesives, not exceeding 1kg net weight
3507 Enzymes; prepared enzymes not elsewhere specified or included
3601 Explosives; propellent powders
3602 Prepared explosives, other than propellent powders
3603 Safety fuses; detonating fuses; percussion or detonating caps; igniters; electric detonators
3604 Fireworks, signalling flares, rain rockets, fog signals and other pyrotechnic articles
3605 Matches; other than pyrotechnic articles of heading no. 3604
3606 Ferro-cerium and other pyrophoric alloys in all forms; articles of combustible materials n.e.s. in chapter 36
3701 Photographic plates and film in the flat, sensitised, unexposed, of any material other than paper, paperboard or textiles; instant print film in the flat, sensitised, unexposed, whether or not in packs
3702 Photographic film in rolls, sensitised, unexposed, of any material other than paper, paperboard or textiles; instant print film in rolls, sensitised, unexposed
3703 Photographic paper, paperboard and textiles; sensitised, unexposed
3704 Photographic plates, film, paper, paperboard and textiles, exposed but not developed
3705 Photographic plates and film; exposed and developed, other than cinematographic film
3706 Cinematographic film; exposed and developed, whether or not incorporating sound track or consisting only of sound track
3707 Chemical preparations for photographic uses (other than varnishes, glues, adhesives and similar preparations); unmixed products for photographic uses, put up in measured portions or for retail sale
3801 Artificial graphite; colloidal or semi-colloidal graphite; preparations based on graphite or other carbon in the form of pastes, blocks, plates or other semi-manufactures
3802 Activated carbon; activated natural mineral products; animal black, including spent animal black
3803 Tall oil, whether or not refined
3804 Residual lyes from the manufacture of wood pulp, whether or not concentrated, desugared or chemically treated, including lignin sulphonates, but excluding tall oil of heading no. 3803
3805 Gum, wood or sulphate turpentine, other turpenic oils; crude dipentene; sulphite turpentine, other crude para-cymene; pine oil containing alpha-terpineol as the main constituent
3806 Rosin and resin acids and derivatives thereof; rosin spirit and rosin oils; run gums
3807 Wood tar; wood tar oils; wood creosote; wood naphtha; vegetable pitch; brewers' pitch and similar preparations based on rosin, resin acids or on vegetable pitch
3808 Insecticides, rodenticides, fungicides, herbicides, anti-sprouting products, plant growth regulators, disinfectants and the like, put up in forms or packings for retail sale or as preparations or articles
3809 Finishing agents, dye carriers to accelerate the dyeing, fixing of dyestuffs, other products and preparations, of a kind used in the textile, paper, leather or like industries, n.e.s. or included
3810 Metal-pickling preparations; fluxes etc for soldering, brazing; welding powders, pastes of metal and other materials; preparations used as cores or coatings for welding electrodes or rods
3811 Anti-knock preparations, oxidation and gum inhibitors, viscosity improvers, anti-corrosive preparations and the like, for mineral oils (including gasoline) or other liquids used for the same purposes
3812 Prepared rubber accelerators; compound plasticisers for rubber or plastics, n.e.s. or included; anti-oxidising preparations and other compound stabilisers for rubber or plastics
3813 Preparations and charges for fire extinguishers; charged fire-extinguishing grenades
3814 Organic composite solvents and thinners, not elsewhere specified or included; prepared paint or varnish removers
3815 Reaction initiators, reaction accelerators and catalytic preparations n.e.s. or included
3816 Refractory cements, mortars, concretes and similar compositions; other than products of heading no. 3801
3817 Mixed alkylbenzenes and mixed alkylnaphthalenes, other than those of heading no. 2707 or 2902
3818 Chemical elements doped for use in electronics, in the form of discs, wafers or similar forms; chemical compounds doped for use in electronics
3819 Hydraulic brake fluids and other prepared liquids for hydraulic transmission, not containing or containing less than 70% by weight of petroleum oils or oils obtained from bituminous minerals
3820 Anti-freezing preparations and prepared de-icing fluids
3821 Prepared culture media for the development or maintenance of micro-organisms (including viruses and the like) or of plant, human or animal cells
3822 Reagents; diagnostic or laboratory reagents on a backing and prepared diagnostic or laboratory reagents whether or not on a backing, other than those of heading no. 3002 or 3006; certified reference material
3823 Prepared binders for foundry moulds or cores, chemical products and preparations and residual products of the chemical or allied industries, n.e.s. or included, *** NOTE*** data from this heading moved to new heading no. 3824 from 1 January 1996
3824 Prepared binders for foundry moulds or cores; chemical products and preparations of the chemical or allied industries (including those consisting of mixtures of natural products), not elsewhere specified or included
3825 Residual products of the chemical or allied industries, not elsewhere specified or included; municipal waste; sewage sludge; other residual products.
3826 Biodiesel and mixtures thereof; not containing or containing less than 70% by weight of petroleum oils or oils obtained from bituminous minerals
3827 Mixtures containing halogenated derivatives of methane, ethane or propane, not elsewhere specified or included
3901 Polymers of ethylene, in primary forms
3902 Polymers of propylene or of other olefins, in primary forms
3903 Polymers of styrene, in primary forms
3904 Polymers of vinyl chloride or of other halogenated olefins, in primary forms
3905 Polymers of vinyl acetate or of other vinyl esters, in primary forms; other vinyl polymers in primary forms
3906 Acrylic polymers in primary forms
3907 Polyacetals, other polyethers and epoxide resins, in primary forms; polycarbonates, alkyd resins, polyallyl esters and other polyesters, in primary forms
3908 Polyamides in primary forms
3909 Amino-resins, phenolic resins and polyurethanes, in primary forms
3910 Silicones in primary forms
3911 Petroleum resins, coumarone-indene resins, polyterpenes, polysulphides, polysulphones and similar products of chemical synthesis n.e.s. in chapter 39, in primary forms
3912 Cellulose and its chemical derivatives, n.e.s. or included, in primary forms
3913 Natural polymers (eg alginic acid) and modified natural polymers (eg hardened proteins, chemical derivatives of natural rubber), n.e.s. or included, in primary forms
3914 Ion-exchangers; based on polymers of heading no. 3901 to 3913, in primary forms
3915 Waste, parings and scrap, of plastics
3916 Monofilament of which any cross-sectional dimension exceeds 1mm, rods, sticks and profile shapes, whether or not surface-worked but not otherwise worked, of plastics
3917 Tubes, pipes and hoses and fittings thereof (for example, joints, elbows, flanges), of plastics
3918 Floor coverings of plastics, self-adhesive or not, in rolls or tiles; wall or ceiling coverings of plastics, in rolls of a width not less than 45cm
3919 Self-adhesive plates, sheets, film, foil, tape, strip and other flat shapes, of plastics, whether or not in rolls
3920 Plastics; plates, sheets, film, foil and strip (not self-adhesive); non-cellular and not reinforced, laminated, supported or similarly combined with other materials, n.e.c. in chapter 39
3921 Plastic plates, sheets, film, foil and strip n.e.s. in chapter 39
3922 Sanitary ware; baths, shower-baths, wash-basins, bidets, lavatory pans, seats and covers, flushing cisterns and similar articles, of plastic
3923 Plastic articles for the conveyance or packing of goods; stoppers, lids, caps and other closures of plastics
3924 Tableware, kitchenware, other household articles and toilet articles, of plastics
3925 Plastics; builders' wares n.e.s. or included
3926 Articles of plastics and articles of other materials of heading no. 3901 to 3914, n.e.s. in chapter 39
4001 Natural rubber, balata, gutta-percha, guayule, chicle and similar gums; in primary forms or in plates, sheets or strip
4002 Synthetic rubber and factice derived from oils, in primary forms or in plates, sheets or strip; mixtures of heading no. 4001 and 4002, in primary forms or in plates, sheets or strip
4003 Reclaimed rubber in primary forms or in plates, sheets or strip
4004 Waste, parings and scrap of rubber (other than hard rubber) and powders and granules obtained therefrom
4005 Compounded rubber, unvulcanised, in primary forms or in plates, sheets or strip
4006 Unvulcanised rubber in other forms (eg rods, tubes and profile shapes) and articles (eg discs and rings)
4007 Vulcanised rubber thread and cord
4008 Plates, sheets, strip, rods and profile shapes, of vulcanised rubber other than hard rubber
4009 Tubes, pipes and hoses, of vulcanised rubber (other than hard rubber), with or without their fittings (eg joints, elbows, flanges)
4010 Conveyor or transmission belts or belting, of vulcanised rubber
4011 New pneumatic tyres, of rubber
4012 Retreaded or used pneumatic tyres of rubber; solid or cushion tyres, tyre treads and tyre flaps, of rubber
4013 Inner tubes, of rubber
4014 Hygienic or pharmaceutical articles (including teats), of vulcanised rubber other than hard rubber, with or without fittings of hard rubber
4015 Articles of apparel and clothing accessories (including gloves, mittens and mitts), for all purposes, of vulcanised rubber other than hard rubber
4016 Articles of vulcanised rubber other than hard rubber, n.e.s. in chapter 40
4017 Hard rubber (eg ebonite) in all forms, including waste and scrap; articles of hard rubber
4101 Raw hides and skins of bovine or equine animals (fresh, salted, dried, limed, pickled, otherwise preserved but not tanned, parchment dressed or further prepared), whether or not dehaired or split
4102 Raw skins of sheep or lambs (fresh, salted, dried, limed, pickled or otherwise preserved, but not further prepared), whether or not with wool on or split
4103 Raw hides and skins n.e.s in headings no. 4101, 4102; fresh, salted, dried, pickled or otherwise preserved, not further prepared, whether or not dehaired or split
4104 Tanned or crust hides and skins of bovine (including buffalo) or equine animals, without hair on, whether or not split, but not further prepared
4105 Tanned or crust skins of sheep and lambs, without wool on, whether or not split, but not further prepared
4106 Tanned or crust hides and skins of other animals, without wool or hair on, whether or not split, but not further prepared
4107 Leather; of animals n.e.s. in chapter 41, without hair on, excluding leather of heading no. 4108 or 4109
4108 Chamois (including combination chamois) leather
4109 Patent leather and patent laminated leather, metallised leather
4110 Parings and other waste of leather or of composition leather, not suitable for the manufacture of leather articles; leather dust, powder and flour
4111 Composition leather with a basis of leather or leather fibre, in slabs, sheets or strip whether or not in rolls
4112 Leather further prepared after tanning or crusting, including parchment dressed leather, of sheep or lamb, without wool on, whether or not split, other than leather of heading 41.14
4113 Leather further prepared after tanning or crusting, including parchment-dressed leather, of animals (other than ovine), without wool or hair on, whether or not split, other than leather of heading 41.14
4114 Chamois (including combination chamois) leather; patent leather and patent laminated leather; metallised leather
4115 Composition leather with a basis of leather or leather fibre, in slabs, sheets or strip, in rolls or not; parings and other waste of leather or of composition leather, not suitable for the manufacture of leather articles; leather dust, powder and flour
4201 Saddlery and harness for any animal (including traces, leads, knee pads, muzzles, saddle cloths, saddle bags, dog coats and the like) of any material
4202 Trunks; suit, camera, jewellery, cutlery cases; travel, tool, similar bags; wholly or mainly covered by leather, composition leather, plastic sheeting, textile materials, vulcanised fibre, paperboard
4203 Articles of apparel and clothing accessories, of leather or of composition leather
4204 Articles of leather or of composition leather, of a kind used in machinery or mechanical appliances or for other technical uses
4205 Leather or composition leather articles n.e.s. in chapter 42
4206 Articles of gut (other than silk-worm gut), of goldbeater's skin, of bladders or of tendons
4301 Raw furskins (including heads, tails, paws, other pieces or cuttings, suitable for furriers' use), excluding raw hides and skins of heading no. 4101, 4102 or 4103
4302 Tanned or dressed furskins (including heads, tails, paws, other pieces, cuttings), unassembled, or assembled (without addition of other materials), excluding those of heading no. 4303
4303 Articles of apparel, clothing accessories and other articles of furskin
4304 Artificial fur and articles thereof
4401 Fuel wood, in logs, billets, twigs, faggots or similar forms; wood in chip or particles; sawdust and wood waste and scrap, whether or not agglomerated in logs, briquettes, pellets or similar forms
4402 Wood charcoal (including shell or nut charcoal), whether or not agglomerated
4403 Wood in the rough, whether or not stripped of bark or sapwood, or roughly squared
4404 Hoopwood; split poles; piles, pickets, stakes of wood, pointed, not sawn lengthwise; wooden sticks, roughly trimmed, not turned, bent, etc., suitable for walking sticks, umbrellas, tool handles, etc.
4405 Wood wool; wood flour
4406 Railway or tramway sleepers (cross-ties) of wood
4407 Wood sawn or chipped lengthwise, sliced, peeled, whether or not planed, sanded or finger jointed, of a thickness exceeding 6mm
4408 Veneer sheets and sheets for plywood (spliced or not) and other wood sawn lengthwise, sliced or peeled, whether or not planed, sanded or finger-jointed, of a thickness not exceeding 6mm
4409 Wood (including strips, friezes for parquet flooring, not assembled), continuously shaped (tongued, grooved, v-jointed, beaded or the like) along any edges, ends or faces, whether or not planed, sanded or end-jointed
4410 Particle board, oriented strand board (OSB) and similar board (e.g. waferboard) of wood or other ligneous materials, whether or not agglomerated with resins or other organic binding substances
4411 Fibreboard of wood or other ligneous materials, whether or not bonded with resins or other organic substances
4412 Plywood, veneered panels and similar laminated wood
4413 Densified wood, in blocks, plates, strips or profile shapes
4414 Wooden frames; for paintings, photographs, mirrors or similar objects
4415 Packing cases, boxes, crates, drums and similar packings, of wood; cable-drums of wood; pallets, box pallets and other load boards, of wood; pallet collars of wood
4416 Casks, barrels, vats, tubs and other coopers' products and parts thereof, of wood, including staves
4417 Tools, tool bodies, tool handles, broom or brush bodies and handles, of wood; boot or shoe lasts and trees, of wood
4418 Builders' joinery and carpentry of wood, including cellular wood panels, assembled parquet panels, shingles and shakes
4419 Tableware and kitchenware, of wood
4420 Wood marquetry and inlaid wood; caskets and cases for jewellery or cutlery, and similar articles of wood; statuettes and other ornaments of wood; wooden articles of furniture not falling in chapter 94
4421 Wooden articles n.e.s. in heading no. 4414 to 4420
4501 Natural cork, raw or simply prepared; waste cork; crushed, granulated or ground cork
4502 Natural cork, debacked or roughly squared, or in rectangular (including square) blocks, plates, sheets or strip, (including sharp-edged blanks for corks or stoppers)
4503 Cork; articles of natural cork
4504 Agglomerated cork (with or without a binding substance) and articles of agglomerated cork
4601 Plaits and similar products of plaiting materials, assembled into strips or not; plaiting materials, plaits and the like bound together in parallel strands or woven in sheet form, finished articles or not
4602 Basketwork, wickerwork and other articles, made directly to shape from plaiting materials or made up from goods of heading no. 4601; articles of loofah
4701 Wood pulp, mechanical wood pulp
4702 Chemical wood pulp, dissolving grades
4703 Chemical wood pulp, soda or sulphate, other than dissolving grades
4704 Chemical wood pulp, sulphite, other than dissolving grades
4705 Wood pulp obtained by a combination of mechanical and chemical pulping processes
4706 Pulps of other fibrous cellulosic material
4707 Waste and scrap of paper and paperboard
4801 Newsprint, in rolls or sheets
4802 Uncoated paper and paperboard, used for writing, printing or other graphics, non perforated punch-cards and punch tape paper, in rolls or rectangular sheets, of any size, other than paper of heading 4801 or 4803; hand-made paper and paperboard
4803 Tissue, towel, napkin stock or similar; for household or sanitary uses, cellulose wadding, webs of cellulose fibres, in rolls over 36cm in width or rectangular sheets with one side exceeding 36cm when unfolded
4804 Uncoated kraft paper and paperboard, in rolls or sheets, other than that of heading no. 4802 or 4803
4805 Uncoated paper and paperboard n.e.s., in rolls or sheets
4806 Vegetable parchment, greaseproof papers, tracing papers, glassine and other glazed transparent or translucent papers, in rolls or sheets
4807 Composite paper and paperboard, (made by sticking layers together with an adhesive), not surface-coated or impregnated, whether or not internally reinforced, in rolls or sheets
4808 Paper and paperboard, corrugated (with or without glued flat surface sheets), creped, crinkled, embossed or perforated, in rolls or sheets other than those of heading no. 4803 or 4818
4809 Carbon paper, self copy paper, and other copying or transfer papers (including coated or impregnated paper for duplicator stencils or offset plates), whether or not printed, in rolls or sheets
4810 Paper and paperboard, one or both sides coated with kaolin or other inorganic substances, with binder or not, no other coating, whether or not surface-coloured, surface-decorated or printed, in rolls or sheets
4811 Paper, paperboard, cellulose wadding and webs of cellulose fibres, coated, impregnated, covered, surface-coloured, decorated or printed, rolls or sheets, other than goods of heading no. 4803, 4809, or 4810
4812 Filter blocks, slabs and plates of paper pulp
4813 Cigarette paper, whether or not cut to size or in the form of booklets or tubes
4814 Wallpaper and similar wall coverings; window transparencies of paper
4815 Floor coverings on a base of paper or of paperboard, whether or not cut to size
4816 Carbon paper, self-copy paper and other copying or transfer papers, (other than those of heading no. 4809), duplicator stencils and offset plates, of paper whether or not put up in boxes
4817 Envelopes, letter cards, plain postcards and correspondence cards, of paper, paperboard; boxes, pouches, wallets and writing compendiums, of paper or paperboard containing assortment of paper stationery
4818 Toilet paper, width 36cm or less or cut to size/shape; handkerchiefs, tissues, towels, serviettes, bed sheets and similar household or hospital articles, apparel and clothing accessories of paper pulp, paper, cellulose wadding or webs of cellulose fibres
4819 Cartons, boxes, cases, bags and the like, of paper, paperboard, cellulose wadding or fibres; box files, letter trays and the like, of paper or paperboard, of a kind used in offices, shops or the like
4820 Registers, account books, diaries and similar; albums for samples or collections, of paper or paperboard
4821 Paper or paperboard labels of all kinds, whether or not printed
4822 Bobbins, spools, cops and similar supports of paper pulp, paper or paperboard (whether or not perforated or hardened)
4823 Paper, paperboard, cellulose wadding and webs of cellulose fibres; cut to size or shape, articles of paper pulp, paper and paper-board, cellulose wadding or webs of cellulose fibres, n.e.s. in chapter 48
4901 Printed books, brochures, leaflets and similar printed matter, whether or not in single sheets
4902 Newspapers, journals and periodicals, whether or not illustrated or containing advertising material
4903 Children's picture, drawing or colouring books
4904 Music, printed or in manuscript, whether or not bound or illustrated
4905 Maps and hydrographic or similar charts of all kinds, including atlases, wall maps, topographical plans and globes, printed
4906 Plans and drawings; for architectural, engineering, industrial, commercial, topographical or similar, being originals drawn by hand; hand-written texts; photo- graphic reproductions; their carbon copies
4907 Unused postage, revenue or similar stamps of current or new issue in the country to which destined; stamp-impressed paper; cheque forms; banknotes, stock, share or bond certificates and the like
4908 Transfers (decalcomanias)
4909 Printed or illustrated postcards; printed cards bearing personal greetings, messages or announcements, whether or not illustrated, with or without envelopes or trimmings
4910 Calendars of any kind, printed, including calendar blocks
4911 Printed matter, n.e.s., including printed pictures and photographs
5001 Silk-worm cocoons suitable for reeling
5002 Raw silk (not thrown)
5003 Silk waste (including cocoons unsuitable for reeling, yarn waste and garnetted stock)
5004 Silk; yarn (other than yarn spun from silk waste), not put up for retail sale
5005 Yarn spun from silk waste, not put up for retail sale
5006 Silk yarn and yarn spun from silk waste, put up for retail sale; silk-worm gut
5007 Woven fabrics of silk or of silk waste
5101 Wool, not carded or combed
5102 Fine or coarse animal hair, not carded or combed
5103 Waste of wool or of fine or coarse animal hair, including yarn waste but excluding garnetted stock
5104 Wool, or fine or coarse animal hair; garnetted stock
5105 Wool and fine or coarse animal hair; carded or combed (including combed wool in fragments)
5106 Yarn of carded wool, not put up for retail sale
5107 Yarn of combed wool, not put up for retail sale
5108 Yarn of fine animal hair (carded or combed), not put up for retail sale
5109 Yarn of wool or of fine animal hair, put up for retail sale
5110 Yarn of coarse animal hair or of horsehair (including gimped horsehair yarn), whether or not put up for retail sale
5111 Woven fabrics of carded wool or of carded fine animal hair
5112 Woven fabrics of combed wool or of combed fine animal hair
5113 Woven fabrics of coarse animal hair or of horsehair
5201 Cotton; not carded or combed
5202 Cotton waste (including yarn waste and garnetted stock)
5203 Cotton, carded or combed
5204 Cotton sewing thread, whether or not put up for retail sale
5205 Cotton yarn (other than sewing thread), containing 85% or more by weight of cotton, not put up for retail sale
5206 Cotton yarn (other than sewing thread), containing less than 85% by weight of cotton, not put up for retail sale
5207 Cotton yarn (other than sewing thread), put up for retail sale
5208 Woven fabrics of cotton, containing 85% or more by weight of cotton, weighing not more than 200 g/m2
5209 Woven fabrics of cotton, containing 85% or more by weight of cotton, weighing more than 200g/m2
5210 Woven fabrics of cotton, containing less than 85% by weight of cotton, mixed mainly or solely with man-made fibres, weighing not more than 200 g/m2
5211 Woven fabrics of cotton, containing less than 85% by weight of cotton, mixed mainly or solely with man-made fibres, weighing more than 200g/m2
5212 Other woven fabrics of cotton, n.e.s. in chapter 52
5301 Flax, raw or processed but not spun; flax tow and waste (including yarn waste and garnetted stock)
5302 True hemp (cannabis sativa L.), raw or processed but not spun; tow and waste of true hemp (including yarn waste and garnetted stock)
5303 Jute and other textile bast fibres (not flax, true hemp and ramie), raw or processed but not spun; tow and waste of these fibres, including yarn waste and garnetted stock
5304 Sisal and other textile fibres of genus agave, raw or processed but not spun; tow and waste of these fibres (including yarn waste and garnetted stock)
5305 Coconut, abaca (manila hemp or musa textilis nee), ramie and other vegetable textile fibres n.e.s., raw or processed but not spun; tow and waste of these fibres (including yarn waste and garnetted stock)
5306 Flax yarn
5307 Yarn of jute or of other textile bast fibres of heading no. 5305
5308 Yarn of other vegetable textile fibres; paper yarn
5309 Woven fabrics of flax
5310 Woven fabrics of jute, other textile bast fibres of heading no. 5303
5311 Woven fabrics of other vegetable textile fibres; woven fabrics of paper yarn
5401 Sewing thread of man-made filaments, whether or not put up for retail sale
5402 Synthetic filament yarn (other than sewing thread), not put up for retail sale, including synthetic monofilament of less than 67 decitex
5403 Artificial filament yarn (other than sewing thread), not put up for retail sale, including artificial monofilament of less than 67 decitex
5404 Synthetic monofilament of 67 decitex or more, of which no cross-sectional dimension exceeds 1mm; strip and the like (eg artificial straw), of synthetic textile materials of a width not exceeding 5mm
5405 Artificial monofilament of 67 decitex or more, no cross-sectional dimension exceeds 1mm; strip and the like (eg artificial straw), of artificial textile materials of a width not exceeding 5mm
5406 Man-made filament yarn (other than sewing thread), put up for retail sale
5407 Woven fabrics of synthetic filament yarn, including woven fabrics obtained from materials of heading no. 5404
5408 Woven fabrics of artificial filament yarn including woven fabrics obtained from materials of heading no. 5404
5501 Synthetic filament tow
5502 Artificial filament tow
5503 Synthetic staple fibres, not carded, combed or otherwise processed for spinning
5504 Artificial staple fibres, not carded, combed or otherwise processed for spinning
5505 Waste (including noils, yarn waste and garnetted stock), of man-made fibres
5506 Synthetic staple fibres, carded, combed or otherwise processed for spinning
5507 Artificial staple fibres, carded, combed or otherwise processed for spinning
5508 Sewing thread of man-made staple fibres, whether or not put up for retail sale
5509 Yarn (other than sewing thread) of synthetic staple fibres, not put up for retail sale
5510 Yarn (other than sewing thread) of artificial staple fibres, not put up for retail sale
5511 Yarn (not sewing thread), of man-made staple fibres, put up for retail sale
5512 Woven fabrics of synthetic staple fibres, containing 85% or more by weight of synthetic staple fibres
5513 Woven fabrics of synthetic staple fibres, containing less than 85% by weight of such fibres, mixed mainly or solely with cotton, of a weight not exceeding 170g/m2
5514 Woven fabrics of synthetic staple fibres, containing less than 85% by weight of such fibres, mixed mainly or solely with cotton, of a weight exceeding 170g/m2
5515 Woven fabrics of synthetic staple fibres, n.e.s. in chapter 55
5516 Woven fabrics of artificial staple fibres
5601 Wadding of textile materials and articles thereof; textile fibres, not exceeding 5 mm in length (flock), textile dust and mill neps
5602 Felt; whether or not impregnated, coated, covered or laminated
5603 Nonwovens; whether or not impregnated, coated, covered or laminated
5604 Rubber thread and cord, textile covered; textile yarn and strip and the like of heading no. 5404, 5405; impregnated, coated, covered or sheathed with rubber or plastics
5605 Yarn; metallised, whether or not gimped, of textile yarn, or strip or the like of heading no. 5404 or 5405, combined with metal in the form of thread, strip or powder or covered with metal
5606 Yarn and strip and the like of heading no. 5404 or 5405, gimped (other than those of heading no. 5606 and gimped horsehair yarn); chenille yarn (including flock chenille yarn); loop wale-yarn
5607 Twine, cordage, ropes and cables, whether or not plaited or braided; whether or not impregnated, coated, covered or sheathed with rubber or plastics
5608 Twine, cordage or rope; knotted netting, made up fishing nets and other made up nets, of textile materials
5609 Articles of yarn, strip or the like of heading no. 5404 or 5405; twine, cordage, rope or cables n.e.s. or included
5701 Carpets and other textile floor coverings; knotted, whether or not made up
5702 Carpets and other textile floor coverings; woven, (not tufted or flocked), whether or not made up, including kelem, schumacks, karamanie and similar hand-woven rugs
5703 Carpets and other textile floor coverings; tufted, whether or not made up
5704 Carpets and other textile floor coverings; of felt, (not tufted or flocked), whether or not made up
5705 Carpets and other textile floor coverings; n.e.s. in chapter 57, whether or not made up
5801 Fabrics; woven pile and chenille fabrics, other than fabrics of heading no. 5802 or 5806
5802 Fabrics; terry towelling and similar woven terry fabrics other than narrow fabrics of heading no. 5806; tufted textile fabrics, excluding products of heading no. 5703
5803 Gauze; other than narrow fabrics of heading no. 5806
5804 Tulles and other net fabrics; not including woven, knitted or crocheted fabrics; lace in the piece, in strips or in motifs, (other than fabrics of headings 60.02 to 60.06)
5805 Tapestries; hand-woven, (gobelins, flanders, aubusson, beauvais and the like) and needle-worked tapestries (eg petit point, cross-stitch) whether or not made up
5806 Fabrics; narrow woven, other than goods of heading no. 5807; narrow fabrics consisting of warp without weft assembled by means of an adhesive (bolducs)
5807 Labels, badges and similar articles; of textile materials, in the piece, in strips or cut to shape or size, not embroidered
5808 Braids in the piece; ornamental trimmings in the piece, without embroidery, other than knitted or crocheted; tassels, pompons and similar articles
5809 Fabrics, woven; of metal thread and metallised yarn of heading no. 5605, of a kind used in apparel, as furnishing fabrics or similar purposes; n.e.s. or included
5810 Embroidery; in the piece, in strips or in motifs
5811 Quilted textile products; in the piece, composed of one or more layers of textile materials assembled with padding by stitching or otherwise (excluding embroidery of heading no. 5810)
5901 Textile fabrics, gum or amylaceous substance coated, used for outer book covers and like; tracing cloth, prepared painting canvas; buckram and similar stiffened textile fabrics used for hat foundation
5902 Textile fabrics; tyrecord of high tenacity yarn of nylon or other polyamides polyesters or viscose rayon
5903 Textile fabrics impregnated, coated, covered or laminated with plastics, other than those of heading no. 5902
5904 Linoleum, whether or not cut to shape; floor coverings consisting of a coating or covering applied on a textile backing, whether or not cut to shape
5905 Textile wall coverings
5906 Textile fabrics, rubberised; other than those of heading no. 5902
5907 Textile fabrics; otherwise impregnated, coated or covered; painted canvas being theatrical scenery, studio back-cloths or the like
5908 Textile wicks, woven, plaited or knitted; for lamps, stoves, lighters, candles or the like; incandescent gas mantles and tubular knitted gas mantle fabric therefor, whether or not impregnated
5909 Textile hosepiping and similar textile tubing; with or without lining, armour or accessories of other materials
5910 Textiles; transmission or conveyor belts or belting, of textile material, whether or not reinforced with metal or other material
5911 Textile products and articles for technical uses; specified in note 7 to this chapter
6001 Fabrics; pile fabrics, including long pile fabrics and terry fabrics, knitted or crocheted
6002 Fabrics; knitted or crocheted, other than those of heading no. 6001
6003 Fabrics; knitted or crocheted fabrics, other than those of heading 60.01 and 60.02, of a width not exceeding 30 cm,
6004 Fabrics; knitted or crocheted fabrics of a width exceeding 30 cm, other than those of heading 60.01, containing by weight 5% or more of elastomeric yarn or rubber thread
6005 Fabrics; warp knit (including those made on galloon knitting machines), other than those of headings 60.01 to 60.04
6006 Fabrics; knitted or crocheted fabrics, other than those of headings 60.01 to 60.04
6101 Coats; men's or boys' overcoats, car-coats, capes, cloaks, anoraks, ski-jackets, wind-cheaters, wind-jackets and similar articles; knitted or crocheted, other than those of heading no. 6103
6102 Coats; women's or girls' overcoats, car-coats, capes, cloaks, anoraks, ski-jackets, wind-cheaters, wind-jackets and similar articles, knitted or crocheted, other than those of heading no. 6104
6103 Suits, ensembles, jackets, blazers, trousers, bib and brace overalls, breeches, shorts (not swimwear); men's or boys', knitted or crocheted
6104 Suits, ensembles, jackets, dresses, skirts, divided skirts, trousers, bib and brace overalls, breeches and shorts (not swimwear), women's or girls', knitted or crocheted
6105 Shirts; men's or boys', knitted or crocheted
6106 Blouses, shirts and shirt-blouses; women's or girls', knitted or crocheted
6107 Underpants, briefs, nightshirts, pyjamas, bathrobes, dressing gowns and similar articles; men's or boys', knitted or crocheted
6108 Slips, petticoats, briefs, panties, nightdresses, pyjamas, negligees, bathrobes, dressing gowns and similar articles; women's or girls', knitted or crocheted
6109 T-shirts, singlets and other vests; knitted or crocheted
6110 Jerseys, pullovers, cardigans, waistcoats and similar articles; knitted or crocheted
6111 Garments and clothing accessories, babies'; knitted or crocheted
6112 Track suits, ski suits and swimwear; knitted or crocheted
6113 Garments made up of knitted or crocheted fabrics of heading no. 5903, 5906 and 5907
6114 Garments; knitted or crocheted, n.e.s. in chapter 61
6115 Hosiery; panty hose, tights, stockings, socks and other hosiery, including stockings for varicose veins and footwear without applied soles, knitted or crocheted
6116 Gloves, mittens and mitts; knitted or crocheted
6117 Clothing accessories; made up, knitted or crocheted, knitted or crocheted parts of garments or of clothing accessories
6201 Overcoats, car-coats, capes, cloaks, anoraks (including ski-jackets), wind-cheaters, wind-jackets and similar articles, men's or boys', other than those of heading no. 6203 (not knitted or crocheted)
6202 Coats; women's or girls' overcoats, carcoats, capes, cloaks, anoraks, ski-jackets, wind-cheaters, wind-jackets and similar articles, other than those of heading no. 6204 (not knitted or crocheted)
6203 Suits, ensembles, jackets, blazers, trousers, bib and brace overalls, breeches and shorts (other than swimwear); men's or boys' (not knitted or crocheted)
6204 Suits, ensembles, jackets, dresses, skirts, divided skirts, trousers, bib and brace overalls, breeches and shorts (other than swimwear); women's or girls' (not knitted or crocheted)
6205 Shirts; men's or boys' (not knitted or crocheted)
6206 Blouses, shirts and shirt-blouses; women's or girls' (not knitted or crocheted)
6207 Singlets and other vests, underpants, briefs, night-shirts, pyjamas, bathrobes, dressing gowns and similar articles; men's or boys' (not knitted or crocheted)
6208 Singlets and other vests, slips, petticoats, briefs, panties, nightdresses, pyjamas, negligees, bathrobes, dressing gowns and similar articles; women's or girls' (not knitted or crocheted)
6209 Garments and clothing accessories; babies' (not knitted or crocheted)
6210 Garments made up of fabrics of heading no. 5602, 5603, 5903, 5906 or 5907 (not knitted or crocheted)
6211 Track suits, swimwear and other garments (not knitted or crocheted)
6212 Brassieres, girdles, corsets, braces, suspenders, garters and similar articles and parts thereof; whether or not knitted or crocheted
6213 Handkerchiefs (not knitted or crocheted)
6214 Shawls, scarves, mufflers, mantillas, veils and the like (not knitted or crocheted)
6215 Ties, bow ties and cravats (not knitted or crocheted)
6216 Gloves, mittens and mitts (not knitted or crocheted)
6217 Clothing accessories n.e.s.; parts of garments or accessories other than those of heading no. 6212 (not knitted or crocheted)
6301 Blankets and travelling rugs
6302 Bed linen, table linen, toilet linen and kitchen linen
6303 Curtains (including drapes) and interior blinds; curtain or bed valances
6304 Furnishing articles; excluding those of heading no. 9404
6305 Sacks and bags, of a kind used for the packing of goods
6306 Tarpaulins, awnings and sunblinds; tents; sails for boats, sailboards or landcraft; camping goods
6307 Textiles; made up articles n.e.s. in chapter 63, including dress patterns
6308 Textiles; sets of woven fabric and yarn, with or without accessories, for making into rugs, tapestries, embroidered tablecloths, serviettes and similar textile articles, in packings for retail sale
6309 Textiles; worn clothing and other worn articles
6310 Rags; used or new, scrap twine, cordage, rope and cables and worn out articles of twine, cordage, rope or cables, of textile materials
6401 Footwear; waterproof, with outer soles and uppers of rubber or plastics, (uppers not fixed to the sole nor assembled by stitch, rivet, nail, screw, plug or similar)
6402 Footwear; with outer soles and uppers of rubber or plastics (excluding waterproof footwear)
6403 Footwear; with outer soles of rubber, plastics, leather or composition leather and uppers of leather
6404 Footwear; with outer soles of rubber, plastics, leather or composition leather and uppers of textile materials
6405 Footwear; other footwear n.e.s. in chapter 64
6406 Footwear; parts of footwear; removable in-soles, heel cushions and similar articles; gaiters, leggings and similar articles, and parts thereof
6501 Hat-forms, hat bodies and hoods of felt, neither blocked to shape nor with made brims; plateaux and manchons (including slit manchons) of felt
6502 Hat-shapes; plaited or made by assembling strips of any material, neither blocked to shape, nor with made brims, nor lined, nor trimmed
6503 Hats and other felt headgear; made from the hat bodies, hoods or plateaux of heading no. 6501, whether or not lined or trimmed
6504 Hats and other headgear; plaited or made by assembling strips of any material, whether or not lined or trimmed
6505 Hats and other headgear; knitted or crocheted, or made up from lace, felt or other textile fabric, in the piece (but not in strips), whether or not lined or trimmed; hair-nets of any material, whether or not lined or trimmed
6506 Headgear; n.e.s. in chapter 65, whether or not lined or trimmed
6507 Head-bands, linings, covers, hat foundations, hat frames, peaks and chinstraps, for headgear
6601 Umbrellas; sun umbrellas (including walking stick umbrellas, garden umbrellas and similar umbrellas)
6602 Walking-sticks, seat-sticks, whips, riding-crops and the like
6603 Trimmings, parts and accessories of articles of heading no. 6601 or 6602
6701 Skin and other parts of birds with their feather or down; feathers, parts of feather, down and articles thereof (other than goods of heading no. 0505 and worked quills and scapes)
6702 Flowers, foliage and fruit, artificial, and parts thereof; articles made of artificial flowers, foliage or fruit
6703 Human hair, dressed, thinned, bleached or otherwise worked; wool or other animal hair or other textile materials, prepared for use in making wigs or the like
6704 Wigs, false beards, eyebrows and eyelashes, switches and the like, of human or animal hair or of textile materials; articles of human hair, n.e.s. or included
6801 Stone; setts, curbstones and flagstones, of natural stone (except slate)
6802 Monumental or building stone, worked (except slate) and articles thereof (not of heading no. 6801) mosaic cubes etc., of natural stone including slate; artificially coloured granules of natural stone
6803 Slate, worked; and articles of slate or of agglomerated slate
6804 Millstones, grindstones, grinding wheels, etc without frameworks, for grinding, sharpening, polishing, etc and parts thereof, natural stone, agglomerated natural or artificial abrasives or of ceramics
6805 Abrasive powder or grain; natural or artificial, on a base of textile material, of paper, paperboard or of other material, whether or not cut to shape or sewn or otherwise made up
6806 Slag, rock wool and similar mineral wools; exfoliated vermiculite, expanded clays, foamed slag, mixtures and articles of heat, sound insulating or sound-absorbing mineral materials
6807 Asphalt or similar material; articles (eg petroleum bitumen or coal tar pitch)
6808 Panels, boards, tiles, blocks and the like; of vegetable fibre, of straw, shavings, chips, particles, sawdust or other waste, of wood, agglomerated with cement, plaster or other mineral binders
6809 Plaster or compositions based on plaster; articles thereof
6810 Cement, concrete or artificial stone; whether or not reinforced, articles thereof
6811 Asbestos-cement, of cellulose fibre-cement or the like
6812 Fabricated asbestos fibres; mixtures with a basis of asbestos or of asbestos and magnesium carbonate; articles of such mixtures or of asbestos (e.g. thread, woven fabric, clothing, footwear), whether or not reinforced, not goods of heading 6811 or 6813
6813 Friction material and articles thereof (eg sheets, rolls, strips, segments, discs, washers, pads) not mounted; for brakes, clutches, with a basis of asbestos, other mineral substances, or cellulose
6814 Mica; worked, articles of, including agglomerated or reconstituted mica; whether or not on a support of paper, paperboard or other materials
6815 Stone or other mineral substances; articles thereof (including articles of peat), n.e.s. or included
6901 Bricks, blocks, tiles and other ceramic goods of siliceous fossil meals (eg kieselguhr, tripolite or diatomite) or of similar siliceous earths
6902 Refractory bricks, blocks, tiles and similar refractory ceramic constructional goods; other than those of siliceous fossil meals or similar siliceous earths
6903 Ceramic goods; (eg retorts, crucibles, muffles, nozzles, plugs, supports cupels, tubes, pipes, sheaths, rods) excluding those of siliceous fossil meals or of similar siliceous earths
6904 Ceramic building bricks, floor blocks, support or filler tiles and the like
6905 Roofing tiles, chimney-pots, cowls, chimney liners, architectural ornaments and other ceramic constructional goods
6906 Ceramic pipes, conduits, guttering and pipe fittings
6907 Ceramic flags and paving, hearth or wall tiles; ceramic mosaic cubes and the like, whether or not on a backing; finishing ceramics
6908 Ceramic flags and paving, hearth or wall tiles, glazed; glazed ceramic mosaic cubes and the like, whether or not on a backing
6909 Ceramic ware for laboratory, chemical, other technical uses; ceramic troughs, tubs, similar receptacles used in agriculture; ceramic pots, jars and similar used in the conveyance or packing of goods
6910 Ceramic sinks, wash basins, wash basin pedestals, baths, bidets, water closet pans, flushing cisterns, urinals and similar sanitary fixtures
6911 Tableware, kitchenware, other household articles and toilet articles; of porcelain or china
6912 Ceramic tableware, kitchenware, other household articles and toilet articles; other than of porcelain or china
6913 Statuettes and other ornamental ceramic articles
6914 Ceramic articles; n.e.s. in chapter 69
7001 Glass; cullet and other waste and scrap of glass, glass in the mass
7002 Glass in balls (other than microspheres of heading no. 7018), rods or tubes, unworked
7003 Glass; cast glass and rolled glass in sheets or profiles, whether or not having an absorbent, reflecting or non-reflecting layer, but not otherwise worked
7004 Glass; drawn glass and blown glass, in sheets, whether or not having an absorbent, reflecting or non-reflecting layer, but not otherwise worked
7005 Glass; float glass and surface ground or polished glass, in sheets, whether or not having an absorbent, reflecting or non-reflecting layer, but not otherwise worked
7006 Glass of heading no. 7003, 7004 or 7005, bent, edge-worked, engraved, drilled, enamelled or otherwise worked, not framed or fitted with other materials
7007 Safety glass, consisting of toughened (tempered) or laminated glass
7008 Glass; multiple-walled insulating units of glass
7009 Glass mirrors; whether or not framed, including rear-view mirrors
7010 Carboys, bottles, flasks, jars, pots, phials, ampoules, containers of glass of a kind used for the conveyance or packing of goods; preserving jars of glass; stoppers, lids and other closures of glass
7011 Glass envelopes (including bulbs and tubes), open and glass parts thereof, without fittings, for electric lamps, cathode-ray tubes or the like
7012 Glass; inners for vacuum flasks or other vacuum vessels
7013 Glassware of a kind used for table, kitchen, toilet, office, indoor decoration or similar purposes (other than of heading no. 7010 or 7018)
7014 Signalling glassware and optical elements of glass (other than those of heading no. 7015), not optically worked
7015 Clock, watch and similar glasses, glasses for non-corrective or corrective spectacles, curved, bent, hallowed etc, not optically worked; hollow glass spheres and their segments for manufacture
7016 Glass; paving blocks, slabs, bricks, tiles etc, of pressed, moulded glass, whether or not wired, glass smallwares for decorative purposes leaded lights and the like; multicellular or foam glass
7017 Laboratory, hygienic or pharmaceutical glassware, whether or not graduated or calibrated
7018 Glass beads, imitation pearls, precious or semi-precious stones and similar glass smallwares, statuettes and other ornaments of worked glass; glass microspheres not exceeding 1mm in diameter
7019 Glass fibres (including glass wool) and articles thereof (eg yarn, woven fabrics)
7020 Glass; articles n.e.s. in chapter 70
7101 Pearls; natural or cultured, whether or not worked or graded but not strung, mounted or set; ungraded pearls, natural or cultured, temporarily strung for convenience of transport
7102 Diamonds, whether or not worked, but not mounted or set
7103 Precious (excluding diamond) and semi-precious stone; worked, graded, not strung, mounted, set; ungraded precious (excluding diamond) and semi-precious stone, temporarily strung for convenience of transport
7104 Synthetic, reconstructed precious, semi-precious stone worked, graded or not, not strung or mounted, set; ungraded synthetic, reconstructed precious, semi-precious stones, temporarily strung for transport
7105 Dust and powder of natural or synthetic precious or semi-precious stone
7106 Silver (including silver plated with gold or platinum); unwrought or in semi-manufactured forms, or in powder form
7107 Base metals clad with silver; not further worked than semi-manufactured
7108 Gold (including gold plated with platinum) unwrought or in semi-manufactured forms, or in powder form
7109 Base metals or silver, clad with gold, not further worked than semi-manufactured
7110 Platinum; unwrought or in semi-manufactured forms, or in powder form
7111 Base metals, silver or gold, clad with platinum; not further worked than semi-manufactured
7112 Waste and scrap of precious metal or of metal clad with precious metal; other waste and scrap containing precious metal compounds, of a kind uses principally for the recovery of precious metal
7113 Jewellery articles and parts thereof, of precious metal or of metal clad with precious metal
7114 Articles of goldsmiths' or silversmiths' wares and parts thereof, of precious metal or of metal clad with precious metal
7115 Articles of precious metal or of metal clad with precious metal
7116 Articles of natural or cultured pearls, precious or semi-precious stones (natural, synthetic or reconstructed)
7117 Imitation jewellery
7118 Coin
7201 Pig iron and spiegeleisen in pigs, blocks or other primary forms
7202 Ferro-alloys
7203 Ferrous products obtained by direct reduction of iron ore and other spongy ferrous products, in lumps, pellets or the like; iron having a minimum purity of 99.94%, in lumps, pellets or similar forms
7204 Ferrous waste and scrap; remelting scrap ingots of iron or steel
7205 Granules and powders, of pig iron, spiegeleisen, iron or steel
7206 Iron and non-alloy steel in ingots or other primary forms (excluding iron of heading no. 7203)
7207 Iron or non-alloy steel; semi-finished products thereof
7208 Iron or non-alloy steel; flat-rolled products of a width of 600mm or more, hot-rolled, not clad, plated or coated
7209 Iron or non-alloy steel; flat-rolled products, width 600mm or more, cold-rolled (cold-reduced), not clad, plated or coated
7210 Iron or non-alloy steel; flat-rolled products, width 600mm or more, clad, plated or coated
7211 Iron or non-alloy steel; flat-rolled products, width less than 600mm, not clad, plated or coated
7212 Iron or non-alloy steel; flat-rolled products, width less than 600mm, clad, plated or coated
7213 Iron or non-alloy steel; bars and rods, hot-rolled, in irregularly wound coils
7214 Iron or non-alloy steel; bars and rods, not further worked than forged, hot-rolled, hot drawn or hot-extruded, but including those twisted after rolling
7215 Iron or non-alloy steel; bars and rods, n.e.s. in chapter 72
7216 Iron or non-alloy steel, angles, shapes and sections
7217 Wire of iron or non-alloy steel
7218 Stainless steel in ingots or other primary forms; semi-finished products of stainless steel
7219 Stainless steel; flat-rolled products of width of 600mm or more
7220 Stainless steel; flat-rolled products of width less than 600mm
7221 Stainless steel bars and rods, hot-rolled, in irregularly wound coils
7222 Stainless steel bars and rods, angles, shapes and sections
7223 Stainless steel wire
7224 Alloy steel in ingots or other primary forms, semi-finished products of other alloy steel
7225 Alloy steel flat-rolled products, of a width 600mm or more
7226 Alloy steel flat-rolled products, of a width of less than 600mm
7227 Steel, alloy; bars and rods, hot-rolled, in irregularly wound coils
7228 Alloy steel bars, rods, shapes and sections; hollow drill bars and rods, of alloy or non-alloy steel
7229 Wire of other alloy steel
7301 Iron or steel sheet piling, whether or not drilled, punched or made from assembled elements; welded angles, shapes and sections, of iron or steel
7302 Railway or tramway track constructions of iron or steel; rails, check and track rails, switch blades, crossing frogs, point rods, sleepers, fish-plates, chair wedges, sole plates, bedplates, ties and the like
7303 Tubes, pipes and hollow profiles, of cast iron
7304 Tubes, pipes and hollow profiles, seamless, of iron (other than cast iron) or steel
7305 Tubes and pipes (eg welded, riveted or similarly closed), internal and external circular cross-sections, external diameter of which exceeds 406.4mm, of iron or steel
7306 Tubes, pipes and hollow profiles (eg open seam or welded, riveted or similarly closed), of iron or steel
7307 Tube or pipe fittings (eg couplings, elbows, sleeves), of iron or steel
7308 Structures of iron or steel and parts thereof; plates, rods, angles, shapes, sections, tubes and the like, prepared for use in structures
7309 Reservoirs, tanks, vats and similar containers; for any material (excluding compressed or liquefied gas), of iron or steel, capacity exceeding 300l, whether or not lined or heat insulated
7310 Tanks, casks, drums, cans, boxes and similar containers, for any material (excluding compressed or liquefied gas), of iron or steel, capacity not exceeding 300l, whether or not lined or heat-insulated
7311 Containers for compressed or liquefied gas, of iron or steel
7312 Stranded wire, ropes, cables, plaited bands, slings and the like, of iron or steel, not electrically insulated
7313 Barbed wire of iron or steel; twisted hoop or single flat wire, barbed or not and loosely twisted double wire, of a kind used for fencing, of iron or steel
7314 Cloth (including endless bands), grill, netting and fencing, of iron or steel wire; expanded metal of iron or steel
7315 Chain and parts thereof, of iron or steel
7316 Anchors, grapnels and parts thereof, of iron or steel
7317 Nails, tacks, drawing pins, corrugated nails, staples (not those of heading no. 8305) and the like, of iron or steel, with heads of other material or not, but excluding articles with heads of copper
7318 Screws, bolts, nuts, coach screws, screw hooks, rivets, cotters, cotter-pins, washers (including spring washers) and similar articles, of iron or steel
7319 Sewing and knitting needles, bodkins, crochet hooks, embroidery stilettos and similar articles, for use in the hand, of iron or steel; safety pins and other pins of iron or steel, not elsewhere specified or included
7320 Springs and leaves for springs, of iron or steel
7321 Stoves, ranges, grates, cookers (those with subsidiary boilers for central heating), barbecues, braziers, gas-rings, plate warmers and similar non-electric domestic appliances and parts, of iron or steel
7322 Radiators for central heating, not electrically heated and parts thereof, of iron or steel; air heaters, hot air distributors not electrically heated, with motor fan or blower
7323 Table, kitchen, other household articles and parts, of iron or steel; iron or steel wool; pot scourers and scouring or polishing pads, gloves and the like, of iron or steel
7324 Sanitary ware and parts thereof, of iron or steel
7325 Iron or steel; cast articles
7326 Iron or steel; articles, n.e.s. in chapter 73
7401 Copper mattes; cement copper (precipitated copper)
7402 Copper; unrefined, copper anodes for electrolytic refining
7403 Copper; refined and copper alloys, unwrought
7404 Copper; waste and scrap
7405 Copper; master alloys
7406 Copper; powders and flakes
7407 Copper; bars, rods and profiles
7408 Copper wire
7409 Copper plates, sheets and strip; of a thickness exceeding 0.15mm
7410 Copper foil (whether or not printed or backed with paper, paperboard, plastics or similar backing materials) of a thickness (excluding any backing) not exceeding 0.15mm
7411 Copper tubes and pipes
7412 Copper; tube or pipe fittings (eg couplings, elbows, sleeves)
7413 Copper; stranded wire, cables, plaited bands and the like, not electrically insulated
7414 Copper; cloth (including endless bands) of copper wire, grill and netting, expanded metal of copper
7415 Nails, tacks, drawing pins, staples (not those of heading no. 8305) and the like, of copper or iron or steel with heads of copper; screws bolts, nuts, screws hooks, rivets, cotters, washers of copper
7416 Copper springs
7417 Cooking or heating apparatus of a kind used for domestic purposes, non-electric and parts thereof, of copper
7418 Table, kitchen or other household articles and parts thereof, of copper; pot scourers, scouring, polishing pads, gloves and the like, of copper; sanitary ware and parts thereof, of copper
7419 Copper; articles thereof n.e.s.
7501 Nickel mattes; nickel oxide sinters and other intermediate products of nickel metallurgy
7502 Nickel; unwrought
7503 Nickel; waste and scrap
7504 Nickel; powders and flakes
7505 Nickel; bars, rods, profiles and wire
7506 Nickel; plates, sheets, strip and foil
7507 Nickel; tubes, pipes and tube or pipe fittings (eg couplings, elbows, sleeves)
7508 Nickel; other articles thereof n.e.s.
7601 Aluminium; unwrought
7602 Aluminium; waste and scrap
7603 Aluminium; powders and flakes
7604 Aluminium; bars, rods and profiles
7605 Aluminium wire
7606 Aluminium; plates, sheets and strip, thickness exceeding 0.2mm
7607 Aluminium foil (whether or not printed or backed with paper, paperboard, plastics or similar backing materials) of a thickness (excluding any backing) not exceeding 0.2mm
7608 Aluminium; tubes and pipes
7609 Aluminium; tube or pipe fittings (eg couplings, elbows, sleeves)
7610 Aluminium; structures (excluding prefabricated buildings of heading no. 9406) and parts (eg bridges and sections, towers, lattice masts, etc) plates, rods, profiles and tubes for structures
7611 Aluminium; reservoirs, tanks, vats and the like for material (not compressed or liquefied gas) of capacity over 300l, whether or not lined, heat-insulated, not fitted with mechanical, thermal equipment
7612 Aluminium casks, drums, cans, boxes etc (including rigid, collapsible tubular containers), for materials other than compressed, liquefied gas, 300l capacity or less, lined, heat-insulated or not
7613 Aluminium; containers for compressed or liquefied gas
7614 Aluminium; stranded wire, cables, plaited bands and the like, (not electrically insulated)
7615 Aluminium; table, kitchen or other household articles and parts thereof, pot scourers and scouring or polishing pads, gloves and the like, sanitary ware and parts thereof
7616 Aluminium; articles n.e.s. in chapter 76
7801 Lead; unwrought
7802 Lead; waste and scrap
7803 Lead; bars, rods, profiles and wire
7804 Lead; plates, sheets, strip and foil, lead powders and flakes
7805 Lead; tubes, pipes and tube or pipe fittings (eg couplings, elbows, and sleeves)
7806 Lead; articles n.e.s. in chapter 78
7901 Zinc; unwrought
7902 Zinc; waste and scrap
7903 Zinc; dust, powders and flakes
7904 Zinc; bars, rods, profiles and wire
7905 Zinc; plates, sheets, strip and foil
7906 Zinc; tubes, pipes and tube or pipe fittings (eg couplings, elbows, sleeves)
7907 Zinc; articles n.e.s. in chapter 79
8001 Tin; unwrought
8002 Tin; waste and scrap
8003 Tin; bars, rods, profiles and wire
8004 Tin; plates, sheets and strip, of a thickness exceeding 0.2mm
8005 Tin foil; (whether or not printed or backed with paper, paperboard, plastics or similar backing materials), of a thickness (excluding any backing) not exceeding 0.2mm, tin powders and flakes
8006 Tin; tubes, pipes and tube or pipe fittings (eg couplings, elbows, sleeves)
8007 Tin; articles n.e.s. in chapter 80
8101 Tungsten (wolfram); articles thereof, including waste and scrap
8102 Molybdenum; articles thereof, including waste and scrap
8103 Tantalum; articles thereof, including waste and scrap
8104 Magnesium; articles thereof, including waste and scrap
8105 Cobalt; mattes and other intermediate products of cobalt metallurgy, cobalt and articles thereof, including waste and scrap
8106 Bismuth; articles thereof, including waste and scrap
8107 Cadmium; articles thereof, including waste and scrap
8108 Titanium; articles thereof, including waste and scrap
8109 Zirconium; articles thereof, including waste and scrap
8110 Antimony; articles thereof, including waste and scrap
8111 Manganese; articles thereof, including waste and scrap
8112 Beryllium, chromium, germanium, vanadium, gallium, hafnium, indium, niobium (columbium), rhenium and thallium; and articles of these metals, including waste and scrap
8113 Cermets; articles thereof, including waste and scrap
8201 Tools, hand; spades, shovels, mattocks, picks, hoes, forks, rakes; axes, bill hooks etc; secateurs and pruners of any kind; scythes, sickles, hay knives, hedge shears, timber wedges and other tools used in agriculture, horticulture, forestry
8202 Tools, hand; saws and blades for saws of all kinds (including slitting, slotting or toothless blades)
8203 Tools, hand; files, rasps, pliers (including cutting pliers), pincers, tweezers, metal cutting shears, pipe cutters, bolt croppers, perforating punches and similar
8204 Tools, hand; hand-operated spanners and wrenches (including torque meter wrenches but not including tap wrenches), interchangeable spanner sockets, with or without handles
8205 Tools, hand; (including glaziers' diamonds) n.e.s.; blow lamps; vices, clamps etc, not accessories for or parts of machine tools; anvils; portable forges; hand, pedal operated grinding wheels with frameworks
8206 Tools, hand; two or more of heading no. 8202 to 8205, put up in sets for retail sale
8207 Tools, interchangeable; for hand tools, whether or not power-operated, or for machine tools (pressing, stamping, punching, drilling etc), including dies for drawing or extruding metal, and rock drilling or earth boring tools
8208 Knives and cutting blades, for machines or for mechanical appliances
8209 Tools; plates, sticks, tips and the like for tools, unmounted, of sintered metal carbides or cermets
8210 Tools; hand-operated mechanical appliances, weighing 10kg or less, used in the preparation, conditioning or serving of food or drink
8211 Knives; with cutting blades, serrated or not (including pruning knives), other than knives of heading no. 8208, and blades therefore
8212 Razors and razor blades; (including razor blade blanks in strips)
8213 Scissors; tailors' shears and similar shears, and blades therefore
8214 Cutlery; other articles, (eg hair clippers, butchers' or kitchen cleavers, choppers and mincing knives, paper knives), manicure or pedicure sets and instruments (including nail files)
8215 Cutlery; spoons, forks, ladles, skimmers, cake-servers, fish-knives, butter knives, sugar tongs and similar kitchen or tableware
8301 Padlocks and locks (key, combination, electrically operated) of base metal; clasps and frames with clasps incorporating locks, of base metal, keys for any or the foregoing articles, of base metal
8302 Base metal mountings, fittings and similar articles for furniture, doors, staircases, windows, trunks, chests etc, castors with mountings of base metal, automatic door closers of base metal
8303 Safes; armoured or reinforced, strong-boxes, doors and safe deposit lockers for strong-rooms, cash or deed boxes and the like, of base metal
8304 Office equipment; filing cabinets, card-index cabinets, paper trays and rests, pen trays, office-stamp stands and the like, of base metal, other than office furniture of heading no. 9403
8305 Stationery; fittings for loose-leaf binders or files, letter clips, letter corners, paper clips, indexing tags and the like, staples in strips (for offices, upholstery, packaging), of base metal
8306 Bells, gongs and the like; non-electric, statuettes, other ornaments, photograph, picture, similar frames, mirrors, of base metal
8307 Tubing; flexible, with or without fittings, of base metal
8308 Clasps; frames with clasps, buckles, hooks, eyes, eyelets etc used for clothing, footwear, awnings, handbags, travel goods or other articles, tubular, bifurcated rivets, beads, spangles, of base metal
8309 Stoppers, caps, lids (including crown corks, screw caps, pouring stoppers); capsules for bottles, threaded bungs, bung covers, seals and other packaging accessories, of base metal
8310 Sign plates, name plates, address plates and similar plates, numbers, letters and other symbols, of base metal, excluding those of heading no. 9405
8311 Wires, rods, tubes, plates, electrodes of base metal or metal carbides; of a kind used for soldering, brazing, welding; wires and rods for metal spraying
8401 Nuclear reactors; fuel elements (cartridges), non-irradiated, for nuclear reactors, machinery and apparatus for isotopic separation
8402 Boilers; steam or other vapour generating (other than central heating hot water boilers, capable also of producing low pressure steam), super heated water boilers
8403 Central heating boilers; excluding those of heading no. 8402
8404 Auxiliary plant for use with boilers of heading no. 8402 or 8403; eg economisers, super-heaters, soot removers, gas recoverers), condensers for steam or other vapour power units
8405 Generators for producer or water gas with or without their purifiers acetylene gas generators and similar water process gas generators, with or without their purifiers
8406 Turbines; steam and other vapour turbines
8407 Reciprocating or rotary internal combustion piston engines
8408 Compression-ignition internal combustion piston engines (diesel or semi-diesel engines)
8409 Parts suitable for use solely or principally with the engines of heading no. 8407 or 8408
8410 Turbines; hydraulic water wheels and regulators therefor
8411 Turbo-jets, turbo-propellers and other gas turbines
8412 Engines and motors; n.e.s. (eg reaction engines, hydraulic power engines, pneumatic power engines)
8413 Pumps; for liquids, whether or not fitted with measuring device, liquid elevators
8414 Air or vacuum pumps, air or other gas compressors and fans; ventilating or recycling hoods incorporating a fan whether or not fitted with filters
8415 Air conditioning machines; comprising a motor driven fan and elements for changing the temperature and humidity, including those machines in which the humidity cannot be separately regulated
8416 Furnace burners for liquid fuel, for pulverised solid fuel or for gas; mechanical grates, mechanical ash dischargers and similar appliances
8417 Furnaces and ovens; industrial or laboratory, including incinerators, non-electric
8418 Refrigerators, freezers and other refrigerating or freezing equipment, electric or other; heat pumps other than air conditioning machines of heading no. 8415
8419 Machinery, plant or laboratory equipment for the treatment of materials by a process involving change of temperature (ie heating, cooking, etc); instantaneous or storage water heaters, non-electric
8420 Machines; calendering or other rolling machines, for other than metal or glass and cylinders therefor
8421 Centrifuges, including centrifugal dryers; filtering or purifying machinery and apparatus for liquids or gases
8422 Dish washing machines; machinery for cleaning, drying, filling, closing, sealing, capsuling or labelling bottles, cans, boxes, bags, etc, machinery for aerating beverages
8423 Weighing machines; excluding balances of a sensitivity of 5cg or better, including weight operated counting or checking machines and weights of all kinds
8424 Mechanical appliances for projecting, dispersing or spraying liquids or powders; fire extinguishers, spray guns, steam, sand blasting machines
8425 Pulley tackle and hoists other than skip hoists; winches and capstans; jacks
8426 Derricks, cranes, including cable cranes, mobile lifting frames, straddle carriers and works trucks fitted with a crane
8427 Fork-lift and other works trucks; fitted with lifting or handling equipment
8428 Lifting, handling, loading or unloading machinery; n.e.c. in heading no. 8425, 8426 or 8427 (e.g. lifts, escalators, conveyors, teleferics)
8429 Bulldozers, graders, levellers, scrapers, angledozers, mechanical shovels, excavators, shovel loaders, tamping machines and road rollers, self-propelled
8430 Moving, grading, levelling, scraping, excavating, tamping, compacting, extracting or boring machinery, for earth, minerals, or ores; pile drivers and extractors; snow ploughs and snow blowers
8431 Machinery parts; used solely or principally with the machinery of heading no. 8425 to 8430
8432 Agricultural, horticultural or forestry machinery for soil preparation or cultivation; lawn or sports-ground rollers
8433 Harvesting and threshing machinery, straw and fodder balers, grass or hay mowers; machines for cleaning, sorting or grading eggs, fruit or other agricultural produce, other than machinery of heading no 8437
8434 Milking machines and dairy machinery
8435 Presses, crushers and similar machinery; used in the manufacture of wine, cider, fruit juices or similar beverages
8436 Agricultural, horticultural, forestry, poultry-keeping, bee-keeping machinery; including germination plant fitted with mechanical or thermal equipment; poultry incubators and brooders
8437 Machines for cleaning, sorting, grading seed, grain, dried leguminous vegetables; machinery used in the milling industry for the working of cereals or dried leguminous vegetables, not farm type machinery
8438 Machinery n.e.s. in this chapter, for the industrial preparation or manufacture of food or drink; other than machinery for extraction or preparation of animal or fixed vegetable fats or oils
8439 Machinery; for making pulp of fibrous cellulosic material, or for making or finishing paper or paperboard
8440 Book-binding machinery; including book-sewing machines
8441 Machines; for making up paper pulp, paper or paperboard, including cutting machines of all kinds
8442 Machinery, apparatus and equipment (excluding machine-tools of heading no. 8456 to 8465) for preparing or making printing components; plates, cylinders and other printing components; lithographic stones prepared for printing purposes
8443 Printing machinery; used for printing by means of the printing type, blocks, plates, cylinders and other printing components of heading 84.42; ink-jet printing machines, other than those of heading 84.71; machines for uses ancillary to printing
8444 Textile machinery; for extruding, drawing, texturing or cutting man-made textile materials
8445 Textile machinery; spinning, doubling, twisting machines, textile reeling or winding machines and machines for preparing textile yarns for use on machines of heading no. 8446 and 8447
8446 Weaving machines (looms)
8447 Knitting machines, stitch-bonding machines and machines for making gimped yarn, tulle, lace, embroidery, trimmings, braid or net and machines for tufting
8448 Machinery, auxiliary; for use with machines of heading no. 8444 to 8447 (eg dobbies, jaquards, automatic stop motions, shuttle changing mechanisms) parts, accessories for machines of heading no. 8444, 8447
8449 Machinery; for manufacture or finishing felt or non-wovens in the piece or in shapes, including machinery for making felt hats, blocks for making hats
8450 Household or laundry-type washing machines; including machines which both wash and dry
8451 Machinery (not of heading no. 8450) for washing, cleaning, wringing, drying, ironing, pressing, bleaching, dyeing, dressing, finishing, coating or impregnating textile yarn, fabrics or made up articles
8452 Sewing machines; other than book-sewing machines of heading no. 8440; furniture, bases and covers specially designed for sewing machines; sewing machine needles
8453 Machinery for preparing, tanning or working hides, skins or leather or for making or repairing footwear or other articles of hides, skins or leather, other than sewing machines
8454 Converters, ladles, ingot moulds and casting machines; of a kind used metallurgy or in metal foundries
8455 Metal-rolling mills and rolls therefor
8456 Machine-tools; for working any material by removal of material, by laser, other light or photon beam, ultrasonic, electro-discharge, electro-chemical, electron beam, ionic beam or plasma arc processes
8457 Machining centres, unit construction machines (single station) and multi-station transfer machines for working metal
8458 Lathes for removing metal
8459 Machine-tools; (including way-type unit head machines) for drilling, boring, milling, threading or tapping by removing metal, other than lathes of heading no. 8458
8460 Machine-tools; for deburring, sharpening, grinding, honing, lapping, polishing or otherwise finishing metal, sintered metal carbides or cermets by means of grinding stones, abrasives or polishing products
8461 Machine-tools; for planing, shaping, slotting, broaching, gear cutting and grinding, finishing, sawing, cutting off and other tools working by removing metal, sintered metal carbides or cermets n.e.s.
8462 Machine-tools; (including presses) for working metal by forging, hammering or die-stamping, for bending, folding, straightening, flattening, shearing or punching metal
8463 Machine-tools; n.e.s. for working metal, sintered metal carbides or cermets without removing material
8464 Machine-tools; for working stone, ceramics, concrete, asbestos-cement or like mineral materials or for cold working glass
8465 Machine-tools; (including machines for nailing, stapling, glueing or otherwise assembling) for working wood, cork, bone, hard plastics or rubber or similar hard materials
8466 Parts & accessories suited for use only/mainly with machines of headings 8456-8465, including work/tool holders, self-opening dieheads, dividing heads & other special attachments for the machines; tool holders for any type of tool for working in the hand
8467 Tools; for working in the hand, pneumatic, hydraulic or with self-contained electric or non-electric motor
8468 Machinery and apparatus for soldering, brazing, welding, whether or not capable of cutting, other than those of heading no. 8515; gas-operated surface tempering machines and appliances
8469 Typewriters other than printers of heading no. 8471; word-processing machines
8470 Calculating machines, accounting machines, cash registers, postage-franking machines, ticket-issuing machines and similar machines, incorporating a calculating device
8471 Automatic data processing machines and units thereof; magnetic or optical readers, machines for transcribing data onto data media in coded form and machines for processing such data n.e.s.
8472 Office machines; not elsewhere classified
8473 Machinery; parts and accessories (other than covers, carrying cases and the like) suitable for use solely or principally with machines of headings 84.70 to 84.72
8474 Machinery for sorting, screening, separating, washing, crushing, grinding, mixing or kneading earth, stone, ores in solid form, shaping, moulding machinery for solid mineral fuels
8475 Machines; for assembling electric or electronic lamps, tubes, valves, flash-bulbs, in glass envelopes, machines for manufacturing or hot working glass or glassware
8476 Automatic goods-vending machines (eg postage stamp, cigarette, food or beverage machines), including money-changing machines
8477 Machinery; for working rubber or plastics or for the manufacture of products from these materials, n.e.s. in this chapter
8478 Machinery; for preparing or making up tobacco, n.e.s. in this chapter
8479 Machinery and mechanical appliances; having individual functions, n.e.s. in this chapter
8480 Moulding boxes for metal foundry, moulding patterns, moulds for metals (excluding ingot moulds), metal carbides, glass, mineral materials, rubber or plastics
8481 Taps, cocks, valves and similar appliances for pipes, boiler shells, tanks, vats or the like, including pressure-reducing valves and thermostatically controlled valves
8482 Ball or roller bearings
8483 Transmission shafts (including cam and crank); bearing housings and plain shaft bearings, gears and gearing, ball screws, gear boxes, flywheels and pulleys, clutches
8484 Gaskets and similar joints of metal sheeting combined with other material; sets or assortments of gaskets and the like, dissimilar in composition, put in pouches, envelopes or the like
8485 Machinery parts; not containing electrical connectors, insulators, coils, contacts or other electrical features, n.e.s. in this chapter
8486 Machines and apparatus of a kind used solely or principally for the manufacture of semiconductor boules or wafers, semiconductor devices, electronic integrated circuits or flat panel displays; machines and apparatus specified in note 9-C to this Chapter
8487 Machinery parts; not containing electrical connectors, insulators, coils, contacts or other electrical features, n.e.c. in this chapter
8501 Electric motors and generators (excluding generating sets)
8502 Electric generating sets and rotary converters
8503 Electric motors and generators; parts suitable for use solely or principally with the machines of heading no. 8501 or 8502
8504 Electric transformers, static converters (eg rectifiers) and inductors
8505 Electro-magnets; permanent magnets, intended permanent magnets; electro-magnetic, permanent magnet chucks, clamps, similar; electromagnetic couplings, clutches, brakes; electro-magnetic lifting heads
8506 Cells and batteries; primary
8507 Electric accumulators, including separators therefor; whether or not rectangular (including square)
8508 Vacuum cleaners
8509 Electro-mechanical domestic appliances; with self-contained electric motor, other than vacuum cleaners of heading 85.08.
8510 Shavers, hair clippers and hair removing appliances, with self-contained electric motor
8511 Ignition or starting equipment; used for spark-ignition or compression-ignition internal combustion engines; generators and cut outs used in conjunction with such engines
8512 Lighting or visual signalling equipment (excluding articles of heading no. 8539), windscreen wipers, defrosters and demisters; electrical, of a kind used for cycles or motor vehicles
8513 Lamps; portable, electric, designed to function by their own source of energy (eg dry batteries, accumulators, magnetos), excluding lighting equipment of heading no. 8512
8514 Industrial or laboratory electric furnaces and ovens (including those functioning by induction or dielectric loss); other industrial or laboratory equipment for the heat treatment of materials by induction or dielectric loss
8515 Electric (electrically heated gas) soldering, brazing, welding machines and apparatus, capable or not of cutting, electric machines and apparatus for hot spraying of metals or sintered carbides
8516 Electric water, space, soil heaters; electro-thermic hair-dressing apparatus; hand dryers, irons; electro-thermic appliances for domestic purposes; electro heating resistors, not of heading no. 8545
8517 Telephone sets, including telephones for cellular networks or for other wireless networks; other apparatus for the transmission or reception of voice, images or other data (including wired/wireless networks), excluding items of 8443, 8525, 8527, or 8528
8518 Microphones and their stands; loudspeakers, mounted or not in their enclosures; headphones and earphones, combined or not with a microphone, and sets of a microphone and one or more loudspeakers; audio frequency and electric sound amplifiers and sets
8519 Turntables, record players, cassette-players and other sound reproducing apparatus; not incorporating a sound recording device
8520 Magnetic tape recorders and other sound recording apparatus; whether or not incorporating a sound reproducing device
8521 Video recording or reproducing apparatus
8522 Sound or video recording apparatus; parts thereof of apparatus of heading no. 8519 to 8521
8523 Media, unrecorded; prepared, for sound recording or similar recording of other phenomena, (excluding products of chapter 37)
8524 Records, tapes and other recorded media for sound or other similarly recorded phenomena, including matrices and masters for record production, excluding products of chapter 37
8525 Transmission apparatus for radio-telephony, radio-telegraphy, radio-broadcasting or television, whether or not incorporating reception/sound recording/reproducing apparatus; TV and still image video cameras; other video camera recorders; digital cameras
8526 Radar apparatus, radio navigational aid apparatus and radio remote control apparatus
8527 Reception apparatus for radio-broadcasting, whether or not combined, in the same housing, with sound recording or reproducing apparatus or a clock.
8528 Television receivers (including video monitors and projectors); combined or not in the same housing with radio-broadcast receivers, sound or video recording or reproducing apparatus
8529 Transmission apparatus; parts suitable for use solely or principally with the apparatus of heading no. 8525 to 8528
8530 Signalling, safety or traffic control equipment; for railways, tramways, roads, inland waterways, parking facilities, port installations, airfields, excluding those of heading no. 8608
8531 Signalling apparatus; electric sound or visual (eg bells, sirens, indicator panels, burglar or fire alarms), excluding those of heading no. 8512 or 8530
8532 Electrical capacitors; fixed, variable or adjustable (pre-set)
8533 Electrical resistors (including rheostats and potentiometers), excluding heating resistors
8534 Circuits; printed
8535 Electrical apparatus for switching, protecting electrical circuits, for making connections to or in electrical circuits; for a voltage exceeding 1000 volts
8536 Electrical apparatus for switching, protecting electrical circuits, for making connections to or in electrical circuits, for a voltage not exceeding 1000 volts; connectors for optical fibres, optical fibre bundles or cables
8537 Boards, panels, consoles, desks, cabinets, bases with apparatus of heading no. 8535, 8536 for electricity control and distribution, (other than switching apparatus of heading no. 8517)
8538 Electrical apparatus; parts suitable for use solely or principally with the apparatus of heading no. 8535, 8536 and 8537
8539 Lamps; electric filament or discharge lamps, including sealed beam lamp units and ultra-violet or infra-red lamps, arc-lamps
8540 Thermionic, cold cathode or photo-cathode valves and tubes (eg vacuum, vapour, gas filled valves and tubes, mercury arc rectifying valves and tubes, cathode-ray and television camera tubes)
8541 Diodes, transistors, similar semiconductor devices; including photovoltaic cells assembled or not in modules, panels, light emitting mounted piezo-electric crystals
8542 Electronic integrated circuits and microassemblies
8543 Electrical machines and apparatus; having individual functions, not specified or included elsewhere in this chapter
8544 Insulated wire, cable and other electric conductors, connector fitted or not; optical fibre cables of individually sheathed fibres, whether or not assembled with electric conductors or fitted with connectors
8545 Carbon electrodes, carbon brushes, lamp carbons, battery carbons and other articles of graphite or other carbon; with or without metal, of a kind used for electrical purposes
8546 Electrical insulators of any material
8547 Insulating fittings; for electrical machines, appliances, equipment, excluding insulators of heading no. 8546, electrical conduit tubing and joints therefore
8548 Waste and scrap of primary cells, primary batteries and electric accumulators; spent primary cells, spent primary batteries and spent electric accumulators; electrical parts of machinery or apparatus, n.e.s. or included elsewhere in chapter 85
8549 Electrical and electronic waste and scrap
8601 Rail locomotives; powered from an external source of electricity or by electric accumulators
8602 Rail locomotives; (other than those of heading no. 8601), locomotive tenders
8603 Railway or tramway coaches, vans and trucks; self-propelled tenders, other than those of heading no. 8604
8604 Railway or tramway maintenance or service vehicles; whether or not self-propelled (eg workshops, cranes, ballast tampers, trackliners, testing coaches and track inspection vehicles)
8605 Railway or tramway coaches; passenger coaches, luggage vans, post office coaches and other special purpose railway or tramway coaches, not self-propelled (excluding those of heading no. 8604)
8606 Railway or tramway goods vans and wagons; not self-propelled
8607 Railway or tramway locomotives or rolling stock; parts thereof
8608 Railway or tramway track fixtures and fittings; mechanical (including electro-mechanical) signalling, safety or traffic control equipment for railways, tramways, roads, inland waterways, parking facilities, port installations or airfields; parts thereof
8609 Containers; (including containers for transport of fluids) specially designed and equipped for carriage by one or more modes of transport
8701 Tractors; (other than tractors of heading no 8709)
8702 Vehicles; public transport passenger type
8703 Motor cars and other motor vehicles; principally designed for the transport of persons (other than those of heading no. 8702), including station wagons and racing cars
8704 Vehicles; for the transport of goods
8705 Special purpose motor vehicles; not those for the transport of persons or goods (eg breakdown lorries, road sweeper lorries, spraying lorries, mobile workshops, mobile radiological units etc)
8706 Chassis; fitted with engines, for the motor vehicles of heading no. 8701 to 8705
8707 Bodies; (including cabs) for the motor vehicles of heading no. 8701 to 8705
8708 Motor vehicles; parts and accessories, of heading no. 8701 to 8705
8709 Works trucks, self-propelled, (not fitted with lifting or handling equipment), for factories, warehouses etc, for short distance transport of goods, tractors used on railway station platforms; parts thereof
8710 Tanks and other armoured fighting vehicles; motorised, whether or not fitted with weapons, and parts of such vehicles
8711 Motorcycles (including mopeds) and cycles; fitted with an auxiliary motor, with or without side-cars; side-cars
8712 Bicycles and other cycles; including delivery tricycles, not motorised
8713 Invalid carriages; whether or not motorised or otherwise mechanically propelled
8714 Vehicles; parts and accessories of heading no. 8711 to 8713
8715 Baby carriages and parts thereof
8716 Trailers and semi-trailers; other vehicles, not mechanically propelled; parts thereof
8801 Balloons and dirigibles; gliders, hang gliders and other non-powered aircraft.
8802 Aircraft; (eg helicopters, aeroplanes), spacecraft (including satellites) and spacecraft launch vehicles
8803 Aircraft; parts of heading no. 8801 or 8802
8804 Parachutes (including dirigible) and rotochutes; parts thereof and accessories thereto
8805 Aircraft launching gear, deck-arrestor or similar gear, ground flying trainers; parts of the foregoing articles
8806 Unmanned aircraft
8807 Aircraft; parts of goods of heading 8801, 8802 or 8806
8901 Cruise ships, excursion boats, ferry-boats, cargo ships, barges and similar vessels for the transport of persons or goods
8902 Fishing vessels, factory ships and other vessels; for processing or preserving fishery products
8903 Yachts and other vessels; for pleasure or sports, rowing boats and canoes
8904 Tugs and pusher craft
8905 Light-vessels, fire-floats, dredgers, floating cranes, other vessels; the navigability of which is subsidiary to main function; floating docks, floating, submersible drilling, production platforms
8906 Vessels; other, including warships and lifeboats, other than rowing boats
8907 Boats, floating structures, other (for eg rafts, tanks, coffer-dams, landing stages, buoys and beacons)
8908 Vessels and other floating structures; for breaking up
9001 Optical fibres and optical fibre bundles; optical fibre cables not of heading no. 8544; sheets, plates of polarising material; lenses, prisms, mirrors, of any material; unmounted; not non optical glass
9002 Lenses, prisms, mirrors and other optical elements, of any material, mounted, being parts or fittings for instruments or apparatus, other than such elements of glass not optically worked
9003 Frames and mountings; for spectacles, goggles or the like, and parts
9004 Spectacles, goggles and the like; corrective, protective or other
9005 Binoculars, monoculars, other optical telescopes, mountings therefore; other astronomical instruments, mountings therefore, but not including instruments for radio-astronomy
9006 Cameras, photographic (excluding cinematographic); photographic flashlight apparatus and flashbulbs other than discharge lamps of heading no. 8539
9007 Cinematographic cameras and projectors, whether or not incorporating sound recording or reproducing apparatus
9008 Image projectors, other than cinematographic; photographic (other than cinematographic) enlargers and reducers
9009 Photocopying apparatus; incorporating an optical system or of the contact type and thermo-copying apparatus
9010 Photographic (including cinematographic) laboratory equipment, (including apparatus for projection of circuit patterns on sensitised semi-conductor materials) n.e.s., negatoscopes; projection screens
9011 Microscopes, compound optical; including those for photomicrography, cinephotomicrography or microprojection
9012 Microscopes (excluding optical microscopes); diffraction apparatus
9013 Liquid crystal devices not constituting articles provided for more specifically in other headings; lasers, not laser diodes; other optical appliances and instruments n.e.s. in this chapter
9014 Navigational instruments and appliances; direction finding compasses
9015 Surveying (including photogrammetrical surveying), hydrographic, oceanographic, hydrological, meteorological or geophysical instruments and appliances, excluding compasses, rangefinders
9016 Balances; of a sensitivity of 5cg or better, with or without weights
9017 Drawing, marking-out, mathematical calculating instruments (drafting machines, protractors, drawing sets etc); instruments for measuring length (eg measuring rods, tapes, micrometers, callipers) n.e.s.
9018 Instruments and appliances used in medical, surgical, dental or veterinary sciences, including scintigraphic apparatus, other electro-medical apparatus and sight testing instruments
9019 Mechano-therapy, massage appliances; psychological aptitude testing apparatus; ozone, oxygen, aerosol therapy, artificial respiration or other therapeutic respiration apparatus
9020 Breathing appliances and gas masks; excluding protective masks having neither mechanical parts nor replaceable filters and excluding apparatus of item no. 9019.20
9021 Orthopaedic appliances; including crutches, surgical belts and trusses; splints and other fracture appliances; artificial parts of the body; hearing aids and other which are worn, carried or implanted in the body to compensate for a defect or disability
9022 X-ray, alpha, beta, gamma radiation apparatus; x-ray tubes, x-ray generators, high tension generators, control panels and desks, screens, examination or treatment tables, chairs and the like
9023 Instruments, apparatus and models, designed for demonstrational purposes (in education or exhibitions), unsuitable for other uses
9024 Machines and appliances for testing the hardness, strength, compressibility, elasticity of other mechanical properties of materials (eg metals, wood, textiles, paper, plastics)
9025 Hydrometers and similar floating instruments, thermometers, pyrometers, barometers, hygrometers and psychrometers, recording or not
9026 Instruments, apparatus for measuring or checking the flow, level, pressure of liquids, gases (eg flow meters, heat meters etc), not instruments and apparatus of heading no. 9014, 9015, 9028 or 9032
9027 Instruments and apparatus; for physical or chemical analysis (eg polarimeters, spectrometers), for measuring or checking viscosity, porosity, etc, for measuring quantities of heat, sound or light
9028 Gas, liquid or electricity supply or production meters, including calibrating meters therefor
9029 Revolution counter, production counters, taximeters, mileometers, pedometers and the like, speed indicators and tachometers, other than those of heading no. 9015, stroboscopes
9030 Instruments, apparatus for measuring, checking electrical quantities not meters of heading no. 9028; instruments, apparatus for measuring or detecting alpha, beta, gamma, x-ray, cosmic and other radiations
9031 Measuring or checking instruments, appliances and machines, n.e.s. or included in this chapter; profile projectors
9032 Regulating or controlling instruments and apparatus; automatic type
9033 Machines and appliances, instruments or apparatus of chapter 90; parts and accessories n.e.s. in chapter 90
9101 Wrist-watches, pocket-watches, stop-watches and other watches; with case of precious metal or of metal clad with precious metal
9102 Wrist-watches, pocket-watches, stop-watches and other watches, other than those of heading no. 9101
9103 Clocks; with watch movements, excluding clocks of heading no. 9104
9104 Instrument panel clocks and clocks of a similar type for vehicles, aircraft, spacecraft or vessels
9105 Clocks, other, n.e.s.
9106 Time of day recording apparatus and apparatus for measuring, recording or otherwise indicating intervals of time, with clock, watch movement or synchronous motor
9107 Time switches; with clock, watch movement or synchronous motor
9108 Watch movements; complete and assembled
9109 Clock movements; complete and assembled
9110 Watch or clock movements, complete, unassembled or partly assembled (movement sets); incomplete watch or clock movements, assembled; rough watch or clock movements
9111 Watch cases and parts thereof
9112 Clock cases and cases of a similar type for other goods of this chapter and parts thereof
9113 Watch straps, watch bands, watch bracelets and parts thereof
9114 Clock or watch parts; n.e.s. in chapter 91
9201 Pianos; including automatic pianos, harpsichords and other keyboard stringed instruments
9202 Musical instruments; string, n.e.s. in heading no. 9201, (eg guitars, violins, harps)
9203 Keyboard pipe organs; harmoniums and similar keyboard instruments with free metal reeds
9204 Accordions and similar instruments; mouth organs
9205 Musical instruments; wind, (eg clarinets, trumpets, bagpipes)
9206 Musical instruments; percussion (eg drums, xylophones, cymbals, castanets, maracas)
9207 Musical instruments; the sound of which is produced or must be amplified, electrically (eg organs, guitars, accordions)
9208 Musical boxes, fairground and mechanical street organs, mechanical singing birds, musical saws and musical instruments nes in chapter 92; decoy calls of all kinds; whistles; call horns and other mouth-blown sound signalling instruments
9209 Musical instrument parts (for example, mechanisms for musical boxes) and accessories (for example, cards, discs and rolls for mechanical instruments); metronomes, tuning forks and pitch pipes
9301 Military weapons; other than revolvers, pistols and arms of heading no. 9307
9302 Revolvers and pistols; other than those of heading no. 9303 or 9304
9303 Firearms; other similar devices (eg sporting shotguns and rifles, muzzle-loading firearms, very pistols, devices for firing flares or blank ammunition, captive bolt humane killers, line throwing guns)
9304 Firearms; (eg spring, air or gas guns and pistols, truncheons), excluding those of heading no. 9307
9305 Firearms; parts and accessories of articles of heading no. 9301 to 9304
9306 Bombs, grenades, torpedoes, mines, missiles and similar munitions of war and parts thereof; cartridges and other ammunition, projectiles and parts thereof, including shot and cartridge wads
9307 Arms; swords, cutlasses, bayonets, lances and the like, parts thereof and scabbards and sheaths therefor
9401 Seats (not those of heading no. 9402), whether or not convertible into beds and parts thereof
9402 Furniture; medical, surgical, dental or veterinary (eg operating tables, hospital beds, dentists' chairs) barbers' chairs; parts
9403 Furniture and parts thereof, n.e.s. in chapter 94
9404 Mattress supports; articles of bedding (eg mattresses, quilts, eiderdowns, cushions pouffes and pillows), fitted with springs or stuffed, whether or not covered
9405 Lamps, light fittings; including searchlights, spotlights and parts thereof, n.e.s.; illuminated signs, name-plates and the like, having permanently fixed light source and parts thereof n.e.s. or included
9406 Buildings; prefabricated
9501 Toys; wheeled, designed to be ridden by children (eg tricycles, scooters, pedal cars), dolls' carriages
9502 Dolls; representing only human beings
9503 Tricycles, scooters, pedal cars and similar wheeled toys; dolls' carriages; dolls; other toys; reduced-size (scale) models and similar recreational models, working or not; puzzles of all kinds
9504 Video game consoles and machines, articles for funfair, table or parlour games, including pintables, billiards, special tables for casino games and automatic bowling alley equipment
9505 Festive, carnival or other entertainment articles, including conjuring tricks and novelty jokes
9506 Gymnastics, athletics, other sports (including table tennis) or outdoor games equipment, n.e.s. in this chapter, swimming pools and paddling pools
9507 Fishing rods, fish-hooks and other line fishing tackle; fish landing nets and the like; decoy birds (not those of heading no. 9208 or 9705) and similar hunting or shooting requisites
9508 Roundabouts, swings, shooting galleries, other fairground amusements, travelling circuses, travelling menageries and travelling theatres
9601 Ivory, bone, tortoise-shell, horn, antlers, coral, mother-of-pearl and other animal carving material and articles of these materials; worked, (including articles obtained by moulding)
9602 Vegetable, mineral carving material and articles of these materials, moulded or carved articles of wax, stearin, natural gums, resins or modelling pastes, worked unhardened gelatin (not heading no. 3503)
9603 Brooms, brushes (including parts of machines), hand operated floor sweepers, mops and feather dusters; knots and tufts for broom or brush making; paint pads and rollers; squeegees
9604 Hand sieves and hand riddles
9605 Travel sets; for personal toilet, sewing, shoe or clothes cleaning
9606 Buttons, press-fasteners, snap-fasteners and press-studs, button moulds and other parts of these articles; button blanks
9607 Slide fasteners and parts thereof
9608 Pens; ball-point, felt tipped, other porous tipped pens; fountain pens, stylograph pens duplicating stylos, propelling or sliding pencils; parts of the foregoing, excluding those of heading no. 9609
9609 Pencils (not of heading no. 9608), crayons, pencil leads, pastels, drawing charcoals, writing or drawing chalks and tailors' chalks
9610 Slates and boards, with writing or drawing surfaces, whether or not framed
9611 Stamps; date, numbering, sealing stamps and the like (including devices for printing or embossing labels), designed for operating by hand; hand operated composing sticks and printing sets
9612 Typewriter, similar ribbons, inked, otherwise prepared for giving impressions, whether or not on spools or in cartridges; ink pads, whether or not inked, with or without boxes
9613 Cigarette lighters and other lighters, whether or not mechanical or electrical and parts thereof other than flints and wicks
9614 Smoking pipes (including pipe bowls) and cigar or cigarette holders, and parts thereof
9615 Combs, hair-slides and similar; hairpins, curling pins, curling grips and hair curlers and the like, other than those of heading no. 8516 and parts thereof
9616 Scent sprays and similar toilet sprays and mounts and heads therefor; powder-puffs and pads for the application of cosmetics or toilet preparations
9617 Vacuum flasks and other vacuum vessels, complete with cases; parts thereof other than glass inners
9618 Tailors' dummies and other lay figures; automata and other animated displays used for shop window dressing
9619 Sanitary towels (pads) and tampons, napkins and napkin liners for babies and similar articles, of any material
9620 Monopods, bipods, tripods and similar articles
9701 Paintings, drawings, pastels, executed entirely by hand; not drawings of heading no. 4906 and not hand-painted, hand-decorated manufactured articles; collages and similar decorative plaques
9702 Engravings, prints and lithographs; original
9703 Sculptures and statuary; original, in any material
9704 Stamps, postage or revenue; stamp-postmarks, first-day covers, postal stationery (stamped paper) and like, used, or if unused not of current or new issue in the country to which they are destined
9705 Collections and collectors' pieces; of zoological, botanical, mineralogical, anatomical, historical, archaeological, palaeontological, ethnographic or numismatic interest
9706 Antiques; of an age exceeding one hundred years
9800 Reserved for national use
9802 Reserved for national use
9806 Reserved for national use
9807 Reserved for national use
9809 Reserved for national use
9810 Reserved for national use
9811 Reserved for national use
9812 Reserved for national use
9813 Reserved for national use
9814 Reserved for national use
9815 Reserved for national use
9816 Reserved for national use
9818 Reserved for national use
9825 Reserved for national use
9829 Reserved for national use
9833 Reserved for national use
9901 Reserved for national use
9902 Reserved for national use
9903 Reserved for national use
9904 Reserved for national use
9999 Commodities not specified according to kind
Indicator
tv_child Commodity group value (US$)
Pakistan | Imports | World | 2021-05
TABLE
LINE
COLUMN
PIE
MAP
Settings
Save query
Download
Share
Embed
Expand
Collapse
Download chart
PNG
JPG
SVG
Download data
XLSX
XLSX (flat table)
XLSX (time series)
Fields
Rows
Columns
Group
Filter
Region
Values
X Axis
Dimensions
Y Axis
Y Axis Dimension
Left Y Axis
Right Y Axis
Options
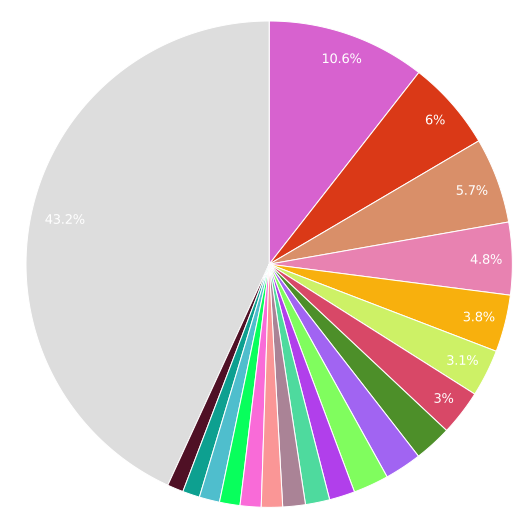
Top imported products to Pakistan in 2021-05:
For detailed data, switch to table visualization and use filters on the left side of the page.
Currently, data download for this dataset is only available in XLSX (flat table) and XLSX (time series) formats. Charts download through the user interface has been suspended.
TABLE
LINE
COLUMN
PIE
MAP
Settings
Save query
Download
Share
Embed
Expand
Collapse
Download chart
PNG
JPG
SVG
Download data
XLSX
XLSX (flat table)
XLSX (time series)
Fields
Rows
Columns
Group
Filter
Region
Values
X Axis
Dimensions
Y Axis
Y Axis Dimension
Left Y Axis
Right Y Axis
Options